Obama Poll Watch -- April, 2016
Obama Consolidates His Gains
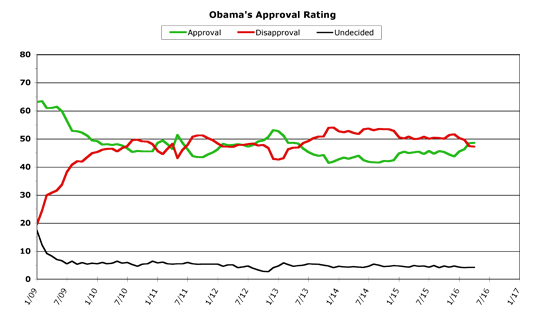
As I predicted last month, President Barack Obama consolidated his recent gains in public opinion polling in April, and only showed very slight improvement in his job approval and job disapproval numbers. While this doesn't sound very exciting, it does show that Obama's recent gains were not temporary, but instead show some real staying power. Let's take a look at the new chart.
[Click on graph to see larger-scale version.]
April, 2016
Even on the big chart, you can now clearly see that Obama is above water in the polling once again (for the first time since the early months of his second term), with his job approval topping his job disapproval rating. This is also the best start to a calendar year Obama has ever seen in either of his two terms -- since December, he has risen 4.9 points in approval while falling 4.4 points in disapproval. Last month, Obama improved both of these metrics by 0.2 percent, which was a slowdown in his upward trajectory from the previous three months. Obama finished April with a monthly average of 48.6 percent job approval and 47.2 percent disapproval, putting him 1.4 points above water.
April was pretty quiet on the political front, at least outside the raucousness of the presidential races. Paul Ryan is probably pretty thankful that so much attention is being paid to the primary races, because it has wonderfully distracted the media from noticing that he's currently failing to get his House of Representatives to do pretty much anything. Congress was supposed to pass a budget framework in mid-April and they were also going to pass some sort of fix to the Puerto Rican budget crisis. They did neither, as the House couldn't agree on the way forward. Ryan is slowly falling into the same trap that ensnared his predecessor John Boehner, but so far the media hasn't been paying much attention.
Instead, April was devoted to following the presidential races. This is likely to be true all the way through the first week in November, in fact. So far, this dynamic has helped President Obama in the polls, but it's hard to see how the rest of the year will play out. Now that Republicans have a nominee, Donald Trump is going to devote all his time and attention on attempting to tie Hillary Clinton to Obama's record and then denigrating everything about that record on a daily basis. Hillary Clinton, meanwhile, will be doing the opposite, by touting Obama's record. She's already tied herself closely with the Obama administration's policies (for the most part) on the campaign trail, which has worked wonders for her among Democratic voters.
But once the nominees emerge from primary season and join the battle for the general election, the dynamic will change. Everyone will be listening to both of them, and evaluating the past eight years for themselves. President Obama will likely begin campaigning (in both subtle and overt ways) for Clinton, which will allow him to personally defend his record to the public. Trump seems to have no limits to what he says, and he is correct when he says that he hasn't even begun to attack Hillary yet. When this battle begins in earnest, it is hard to predict how the public will react when scoring the job the current president is doing. Perhaps they'll look at Obama more favorably, while contemplating who will replace him. But, conversely, perhaps they'll respond to daily Republican attacks on Obama in how they feel -- it's impossible to say right now which strategy will work better.
The only thing that is easy to predict is that the presidential race will continue to be the biggest political story on the news. Congress will barely be mentioned (unless they do something monumentally stupid), and soon all the members will be heading out on the campaign trail themselves. So the election, as usual, will overshadow everything else for most of the rest of the year.
Overall Trends
The overall trend for Obama's poll numbers seems to be rather flat at the moment. After three extremely good months of improvement, Obama's numbers barely budged in April. The good news was that they still continued upwards, but at a much slower pace. Obama's monthly average job approval rose 0.2 points, after rising 1.8 percent, 0.8 percent, and 2.1 percent in the preceding three months. That is a serious flattening of the trend.
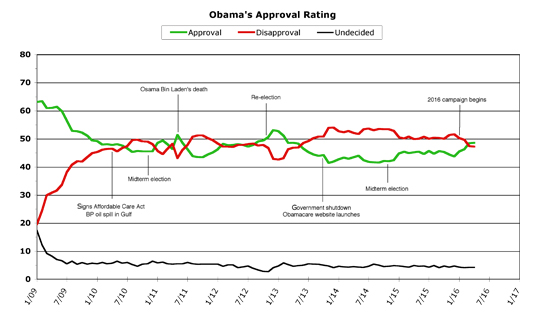
In this case, though, flat is still pretty good. His numbers are higher now than they've been in three years, and it certainly seems like 2016 may be similar to 2012 for Obama. In the run-up to that year's election, Obama held pretty steady in the 47-48 percent range all year, with a final upward movement right around the election (which would turn out to be the start of his "second honeymoon" period). Here's an annotated version of Obama's chart, which shows this more clearly:
[Click on graph to see larger-scale version.]
The period preceding the 2012 election is what 2016 could look like for Obama -- fighting to keep his job approval above his disapproval, with a surge at the end that puts him over the 50 percent barrier.
The daily rolling averages from April seem to show that this period may have begun. Obama's job approval started at 48.6 percent, rose to 49.1 percent but then (due to an outlier poll or two in the mix) turned down to 47.9 percent -- which actually put him underwater for a couple of days. Obama's numbers then improved up to 48.9 percent before falling back a bit to end up at 48.6 percent -- not only the exact number he started at, but also the overall average for the month. Obama's daily disapproval numbers mirrored this trend, except they spiked upwards farther than his job approval numbers spiked downwards, mid-month.
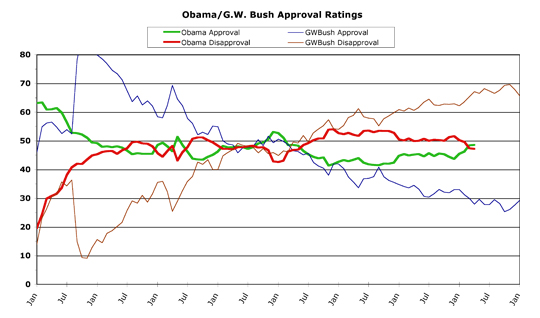
We could see a lot of mixed data of this type, at least for the next few months. Since this is pretty muddy as far as predicting trends goes, instead lets take a look at how Obama's final year in office might match up with previous presidents. Now, back in 2012, Obama's numbers were surprisingly almost identical with George W. Bush's (during his re-election year, 2004). Take a look, and you can clearly see what I'm talking about:
[Click on graph to see larger-scale version.]
Of course, since then Obama's done far better than Bush, who saw his numbers fall off a cliff after getting re-elected. At this point in Dubya's presidency, his job approval was at a dismal 27.9 percent and his disapproval was sky-high, at 67.1 percent. Bush would never again even reach 30 percent approval from the public, for the remainder of his term. So, obviously, Obama's numbers aren't anywhere near a match for Bush's after re-election. Which begs the question, which president will Obama most closely resemble?
Well, the answer is limited. First, there aren't all that many presidents who served more than a single term. Second, public polling data only reliably goes back to Dwight D. Eisenhower (some polling exists for Truman and F.D.R., but it is nowhere near as comprehensive as the data for later presidents). So we realistically only have five presidents to compare Obama to, in his eighth year in office: George W. Bush, Bill Clinton, Ronald Reagan, Lyndon Johnson, and Eisenhower. Nixon was long gone by now, and everyone else was a one-termer.
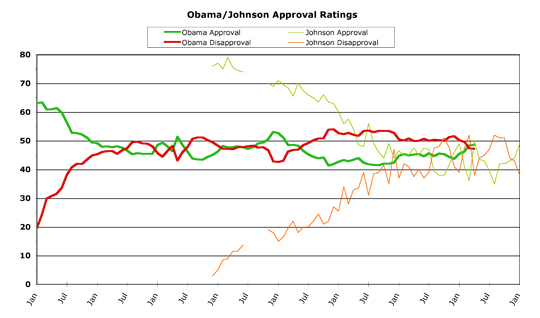
We've already seen that George W. Bush was far below where Obama is likely to end up. It's also easy to see that Obama won't wind up anywhere near the impressive final years of Eisenhower or Clinton. This really leaves only two possibilities. The first is L.B.J., who technically didn't serve two full terms. Close enough, though, for our purposes. As you can see: Johnson had a wild rollercoaster of a ride in his final year in office:
[Click on graph to see larger-scale version.]
The trends bounce around, but you can clearly see how closely the general trend line is to roughly the past year or so for Obama. If L.B.J. turns out to be the closest president to Obama's final year in office, his numbers will fall but then rise before year's end. However, they won't ever top 50 percent again. If this model holds true, it'll be harder for Hillary Clinton to win the election.
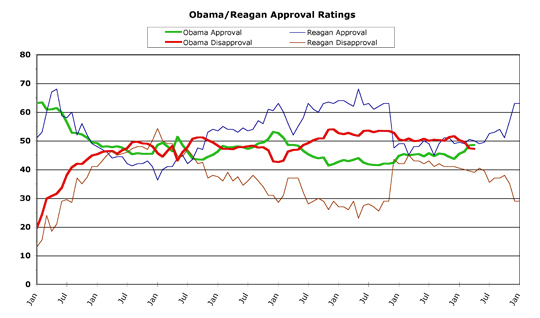
But there's a rosier scenario, too. Take a look at Ronald Reagan's numbers alongside Obama's:
[Click on graph to see larger-scale version.]
Reagan had been riding pretty high in his second term, but that gigantic cliff he fell off was his admission that the Iran-Contra deal was a reality, and that he had, in essence, lied to the American public about what his White House had done. This was a huge loss in public perception of Ronnie, and he spent his seventh year in office slightly above where Obama spent his. However, their job approval lines are now pretty close (Reagan was exactly at 50 percent right now).
Barack Obama could follow a similar trend for his final year, although he probably won't match the end-of-term bump that Reagan managed (Reagan finished with 63.0 percent job approval). Still, if Hillary Clinton reminds a whole lot of people why they voted for Obama in the first place, and if other people begin to be horrified by Donald Trump's ceaseless antics, then Obama could indeed rise above 50 percent over the course of the year, as Reagan did. If Clinton wins the election, then Obama will also likely get a end-of-term bounce (most presidents do manage this, I should mention) and end up well above 50 percent.
So that's really the long-term question for Obama's polling trends -- will he end up like L.B.J. or more like the Gipper? At this point, I'm pretty optimistic that Obama will be closer to Ronnie in his final year of office, which would be entirely fitting, since the polling during Obama's first year in office was closer to Reagan than to any previous president. Ending in sync with Reagan would be a nice historical bookend, in other words.
[Obama Poll Watch Data:]
Sources And Methodology
ObamaPollWatch.com is an admittedly amateur effort, but we do try to stay professional when it comes to revealing our sources and methodology. All our source data comes from RealClearPolitics.com; specifically from their daily presidential approval ratings "poll of polls" graphic page. We take their daily numbers, log them, and then average each month's data into a single number -- which is then shown on our monthly charts here (a "poll of polls of polls," if you will...). You can read a much-more detailed explanation of our source data and methodology on our "About Obama Poll Watch" page, if you're interested.
Questions or comments? Use the Email Chris page to drop me a private note.
Obama's Second Term Statistical Records
Monthly
Highest Monthly Approval -- 1/13 -- 52.7%
Lowest Monthly Approval -- 11/13 -- 41.4%
Highest Monthly Disapproval -- 12/13 -- 54.0%
Lowest Monthly Disapproval -- 1/13 -- 42.6%
Daily
Highest Daily Approval -- 1/31/13 -- 52.5%
Lowest Daily Approval -- 12/2/13 -- 39.8%
Highest Daily Disapproval -- 12/2/13 -- 55.9%
Lowest Daily Disapproval -- 2/24/13 -- 42.3%
Obama's Second Term Raw Monthly Data
[All-time high in bold, all-time low underlined.]
Month -- (Approval / Disapproval / Undecided)
04/16 -- 48.6 / 47.2 / 4.2
03/16 -- 48.4 / 47.4 / 4.2
02/16 -- 46.3 / 49.6 / 4.1
01/16 -- 45.5 / 50.2 / 4.3
12/15 -- 43.7 / 51.6 / 4.7
11/15 -- 44.4 / 51.3 / 4.3
10/15 -- 45.3 / 50.0 / 4.7
09/15 -- 45.6 / 50.3 / 4.1
08/15 -- 44.7 / 50.4 / 4.9
07/15 -- 45.7 / 50.0 / 4.3
06/15 -- 44.6 / 50.7 / 4.7
05/15 -- 45.4 / 50.0 / 4.6
04/15 -- 45.2 / 49.9 / 4.9
03/15 -- 44.9 / 50.8 / 4.3
02/15 -- 45.4 / 50.1 / 4.5
01/15 -- 44.8 / 50.5 / 4.7
12/14 -- 42.4 / 52.8 / 4.8
11/14 -- 42.0 / 53.4 / 4.6
10/14 -- 42.1 / 53.4 / 4.5
09/14 -- 41.5 / 53.5 / 5.0
08/14 -- 41.6 / 53.0 / 5.4
07/14 -- 41.8 / 53.6 / 4.6
06/14 -- 42.4 / 53.4 / 4.2
05/14 -- 44.0 / 51.7 / 4.3
04/14 -- 43.4 / 52.1 / 4.5
03/14 -- 42.9 / 52.8 / 4.3
02/14 -- 43.3 / 52.3 / 4.4
01/14 -- 42.7 / 52.7 / 4.6
12/13 -- 41.9 / 54.0 / 4.1
11/13 -- 41.4 / 53.9 / 4.7
10/13 -- 44.2 / 50.8 / 5.0
09/13 -- 43.9 / 50.8 / 5.3
08/13 -- 44.4 / 50.2 / 5.4
07/13 -- 45.3 / 49.2 / 5.5
06/13 -- 46.5 / 48.5 / 5.0
05/13 -- 48.3 / 46.9 / 4.8
04/13 -- 48.6 / 46.8 / 4.6
03/13 -- 48.5 / 46.3 / 5.2
02/13 -- 51.1 / 43.0 / 5.9
01/13 -- 52.7 / 42.6 / 4.7
Second Term Column Archives
[Mar 16], [Feb 16], [Jan 16], [Dec 15], [Nov 15], [Oct 15], [Sep 15], [Aug 15], [Jul 15], [Jun 15], [May 15], [Apr 15], [Mar 15], [Feb 15], [Jan 15], [Dec 14], [Nov 14], [Oct 14], [Sep 14], [Aug 14], [Jul 14], [Jun 14], [May 14], [Apr 14], [Mar 14], [Feb 14], [Jan 14], Dec 13], [Nov 13], [Oct 13], Sep 13], [Aug 13], [Jul 13], [Jun 13], [May 13], [Apr 13], [Mar 13], [Feb 13], [Jan 13]
First Term Data
To save space, the only data and statistics listed above are from Obama's second term. If you'd like to see the data and stats from Obama's first term, including a list of links to the full archives of the Obama Poll Watch column for the first term, we've set up an Obama Poll Watch First Term Data page, for those still interested.
-- Chris Weigant
Follow Chris on Twitter: @ChrisWeigant



Yeah, yeah. Let's see how BHO holds up during The Great Bathroom Panic of 2016. It's the new Ebola. I don't understand why Trump wants to let Caitlyn use the ladies room. He really should understand how easy it is to unite the party around lies. He needs to help Paul Ryan get there.
I liked when Obama spoke of the reasons for his improved approval ratings at the White House Correspondents' Dinner. He said he thought he knew the reasons for the increase -- and on the big screen flashed a photo of Ted Cruz next to a photo of Donald Trump.
Jeezus, CW...
I pull back from the abyss and THIS is what you have for me!?? :(
heh
Michale
@michale,
get well and feel better
JL
Thanx JL :D
I am on the upside of it. Got a persistent cough that is brutal when I lay down. Think I got a whole 3 hrs of sleep last night..
I think I gave it to my wife though. She's just starting. It's a 4-day thing so I get to nurse her back to health now...
Michale