Obama Poll Watch -- November, 2014
The world (of Obama polling) is flat
I try, as a general rule, to avoid quoting Tom Friedman for any reason whatsoever, but this month's job approval polling for President Obama can really only be described with one word: flat. And once you've got that, it's pretty hard to avoid falling into the depths of a Friedman meme, really.
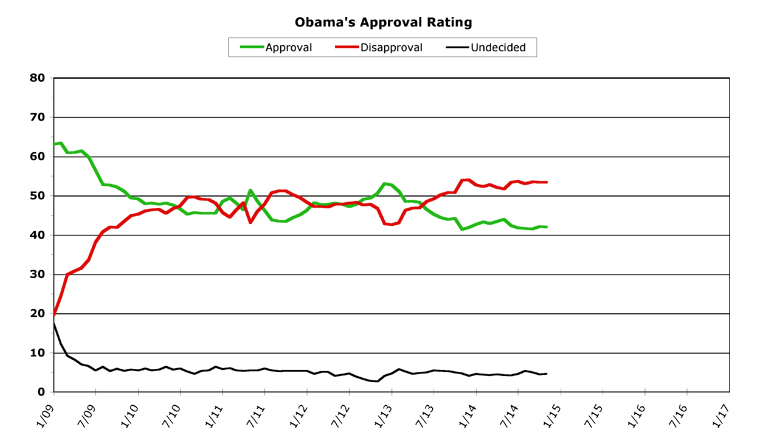
Added together, the differences from October to November for Obama's average monthly job approval and job disapproval ratings total a whopping 0.1 percent. That's pretty flat. Remarkably, this was during a month with several enormous political stories, from the midterm election results to immigration reform to Ferguson, Missouri. Before we get to all of that, let's take a look at the flatness of the chart for November.
[Click on graph to see larger-scale version.]
November, 2014
Obama began the month watching his political party go down to an epic defeat in his second midterm election (the first wasn't any better back in 2010, it bears mentioning). He bounced back pretty quickly, though, and tossed a very large gauntlet at the feet of the congressional Republicans, with his announcement on his new immigration reform policy. Overshadowing the month was the ongoing rage on the streets over the Ferguson, Missouri grand jury decision, but -- astonishingly -- none of this seemed to matter much to public opinion on how the president has been doing his job. There was no cratering of his numbers around or after the election. There has been no spike upwards (or otherwise) over his immigration announcement. All month long, his numbers stayed remarkably flat.
This flatness can be measured in a number of ways. In November, Obama's average monthly job approval rating was 42.0 percent -- down 0.1 percent from last month. His average monthly job disapproval rating was unchanged from last month, at 53.4 percent. Added together, as I've already mentioned, this means a net 0.1 change in both numbers for the month. This is the flattest monthly change of Obama's entire presidency (he's never managed to stay exactly the same in both numbers in one month). This has happened twice before, and (interestingly enough), one of them was in November of 2010, during his first midterm "shellacking." Back then, he stayed the same in approval and improved his disapproval rating by 0.1 percent. The other time he's had this flat of a month was in October of 2011, when he hit the worst job approval and disapproval ratings of his entire first term, during the same month.
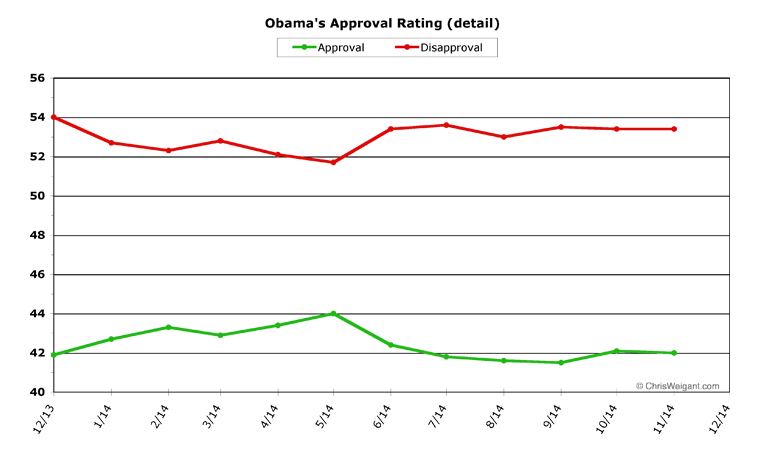
The flatness can be measured in other (more wonky) ways, as well. Taking the absolute range of daily averages, Obama's numbers usually swing around by at least a few points during the month. In October, for instance, Obama's daily average varied between 41.2 and 43.3 percent job approval during the month -- a swing of 2.1 points. His daily disapproval average varied in the 52.3 to 54.7 percent range, a swing of 2.4 percent. Taken together, the variance in both adds up to 4.5 percent, which is an average example. In November, however, his approval shifted from 41.6 to 42.7 percent (a difference of 1.1) and his disapproval ranged from 52.9 percent to 53.9 percent (a 1.0 percent swing). This adds up to only 2.1 percent for both shifts over the course of the month. This is the second-lowest this number has ever been (it was only 1.9 percent in September, 2013), showing once again how flat the month was for Obama.
Overall Trends
Overall, this brings up another observation -- 2014 may well be the flattest year Obama's ever had in the polls (unless something totally unexpected happens before the end of December). Since the beginning of the year, Obama's monthly average job approval rating started at 42.7 percent, went up to 44.0 percent, down to 41.5 percent, and then finished (through November, at least) at 42.0 percent. This is only a 0.7 percent total change, and only a range of 2.5 percent. His disapproval ratings are similarly flat, going from 52.7 percent down to 51.7 percent and then up to 53.6 percent, before settling down to 53.4 percent. In eleven months, a change of the same 0.7 percent as Obama's approval rating, through an even smaller range of only 1.9 percent. By contrast, in 2013, Obama's approval changed from 52.7 percent down to 41.9 percent -- a whopping 10.8 percent difference (while his disapproval shifted an even bigger 11.4 percent). The smallest previous yearly shift in approval for Obama was around three percent in both approval and disapproval. No matter how you measure it, November was the flattest month in the flattest year for President Obama.
Even in an exploded view of the last twelve months, it's hard to see much movement.
[Click on graph to see larger-scale version.]
What does all this flatness portend for the future? Well, it's always tough to predict a trend when the only trend appears to be "no trend," and (as the stockbrokers say) past prediction is no guarantee of future performance. Even with such caveats, sometimes a flat month precedes a rapid turnaround in the polling for the next few months to come.
Let's take a look at three previous flat months for Obama to see what could happen. The first two have already been mentioned -- the two months showing only 0.1 percent change, matching Obama's November numbers as the flattest months ever. Then, as a cautionary note, we'll take a look at one of Obama's second-flattest months, where the numbers changed 0.3 percent.
The first example comes from 2010, in Obama's previous midterm year. Exactly four years ago, Obama charted almost the same November as last month. His approval stayed the same for the month while his disapproval went down 0.1 percent. In the three months which followed the "Great Shellacking," however, Obama's approval improved a total of 3.9 percent, while his disapproval fell 4.5 percent. This was during the period of a lame-duck Congress and the first two months of the incoming Congress in 2011.
One year later, Obama had a flat month in October, falling 0.1 percent in approval while his disapproval held steady (being 2011, there was no congressional election cycle). In the four months afterwards, Obama's approval shot up 4.8 percent, and his disapproval fell 4.0 percent. His approval went from 43.4 percent to 48.2 and his disapproval went from 51.2 percent to 47.2 percent.
Those are interesting indications which could show that a very flat month represents a turning point in how the public feels about the president. It could also show a certain "year-end" effect, as Obama has almost always managed to improve his numbers in the period from November to February (although there are exceptions to this, to be fair).
One of the exceptions is our third example -- the cautionary note. Last October, Obama improved his job approval by 0.3 percent while his disapproval remained the same. But the following month was a terrible one for Obama, as his approval fell 2.8 percent while his disapproval rose a whopping 3.1 percent. Obama's polling did recover somewhat from December to February, but the damage had largely been done. Of course, this was the one-time hit Obama took for the disastrous rollout of the Obamacare website, so it was a rather unique circumstance.
Still, while the historic data look pretty good in the months following a very flat month for Obama, and while roughly from Hallowe'en through Valentine's Day is normally a very good time of year for Obama polling, there is absolutely no guarantee that history will repeat itself this time. In fact, the safe money is probably on "Obama's numbers stay pretty flat in December" as a possible title for next month's column. But Obama's daily numbers were heading in the right direction at the end of November, so there's still a good chance he could have a positive month to end the year.
[Obama Poll Watch Data:]
Sources And Methodology
ObamaPollWatch.com is an admittedly amateur effort, but we do try to stay professional when it comes to revealing our sources and methodology. All our source data comes from RealClearPolitics.com; specifically from their daily presidential approval ratings "poll of polls" graphic page. We take their daily numbers, log them, and then average each month's data into a single number -- which is then shown on our monthly charts here (a "poll of polls of polls," if you will...). You can read a much-more detailed explanation of our source data and methodology on our "About Obama Poll Watch" page, if you're interested.
Questions or comments? Use the Email Chris page to drop me a private note.
Obama's Second Term Statistical Records
Monthly
Highest Monthly Approval -- 1/13 -- 52.7%
Lowest Monthly Approval -- 11/13 -- 41.4%
Highest Monthly Disapproval -- 12/13 -- 54.0%
Lowest Monthly Disapproval -- 1/13 -- 42.6%
Daily
Highest Daily Approval -- 1/31/13 -- 52.5%
Lowest Daily Approval -- 12/2/13 -- 39.8%
Highest Daily Disapproval -- 12/2/13 -- 55.9%
Lowest Daily Disapproval -- 2/24/13 -- 42.3%
Obama's Second Term Raw Monthly Data
[All-time high in bold, all-time low underlined.]
Month -- (Approval / Disapproval / Undecided)
11/14 -- 42.0 / 53.4 / 4.6
10/14 -- 42.1 / 53.4 / 4.5
09/14 -- 41.5 / 53.5 / 5.0
08/14 -- 41.6 / 53.0 / 5.4
07/14 -- 41.8 / 53.6 / 4.6
06/14 -- 42.4 / 53.4 / 4.2
05/14 -- 44.0 / 51.7 / 4.3
04/14 -- 43.4 / 52.1 / 4.5
03/14 -- 42.9 / 52.8 / 4.3
02/14 -- 43.3 / 52.3 / 4.4
01/14 -- 42.7 / 52.7 / 4.6
12/13 -- 41.9 / 54.0 / 4.1
11/13 -- 41.4 / 53.9 / 4.7
10/13 -- 44.2 / 50.8 / 5.0
09/13 -- 43.9 / 50.8 / 5.3
08/13 -- 44.4 / 50.2 / 5.4
07/13 -- 45.3 / 49.2 / 5.5
06/13 -- 46.5 / 48.5 / 5.0
05/13 -- 48.3 / 46.9 / 4.8
04/13 -- 48.6 / 46.8 / 4.6
03/13 -- 48.5 / 46.3 / 5.2
02/13 -- 51.1 / 43.0 / 5.9
01/13 -- 52.7 / 42.6 / 4.7
Second Term Column Archives
[Oct 14], [Sep 14], [Aug 14], [Jul 14], [Jun 14], [May 14], [Apr 14], [Mar 14], [Feb 14], [Jan 14], Dec 13], [Nov 13], [Oct 13], Sep 13], [Aug 13], [Jul 13], [Jun 13], [May 13], [Apr 13], [Mar 13], [Feb 13], [Jan 13]
First Term Data
To save space, the only data and statistics listed above are from Obama's second term. If you'd like to see the data and stats from Obama's first term, including a list of links to the full archives of the Obama Poll Watch column for the first term, we've set up an Obama Poll Watch First Term Data page, for those still interested.
-- Chris Weigant
Cross-posted at The Huffington Post
Follow Chris on Twitter: @ChrisWeigant


the fact that the line flattened out this way twice before begs a very specific question. i wonder if this approval rating is so flat because it's the floor. barring nixonesque revelations, perhaps all the people who were going to change their minds against obama already have.
JL
Obama's numbers will likely remain flat until the new Congress is sworn in..
But then when the GOP starts sending legislation to Obama that actually HELPS the middle class and the lower class and Obama constantly VETOs it (THE POTUS OF NO??) then you will see Obama's numbers plummet..
On the other hand, the one thing (and about the ONLY thing I might add) that I have been consistently wrong about is Obama's polling... :D
Michale
Michale -
Big of you to admit that, just had to say...
As for GOP bills to help the middle class, I'm scratching my head and wondering what, exactly, they contain?
But my real reason for jumping in here is to announce:
There will be kittens, tomorrow!
Count on it, everyone. And be prepared to open your wallets... It's pledge season, once again!
:-)
-CW
Big of you to admit that, just had to say...
Yea, it's my Achilles Heel, apparently.. I call pretty much everything else dead on balls accurate...
"That vershigina heel!!!!"
-Phil, HERCULES
:D
As for GOP bills to help the middle class, I'm scratching my head and wondering what, exactly, they contain?
Just look at the hundreds of bills that the GOP House passed that Reid let sit and die in the Senate...
Hundreds of bills that would have helped the middle class and stimulate the economy but Reid wouldn't let proceed further because it might make the GOP look good..
Sound familiar?? :D
There will be kittens, tomorrow!
No Rotties???? :D
https://katiealange.files.wordpress.com/2009/11/rept-tom-campbells-rottweiler-christmas2006-thumb-640xauto-19383.jpg
:D
Michale
Apropos of absolutely nothing..
MOVIE REVIEW...
Ya'all have simply GOT to see the new Ethan Hawke movie PREDESTINATION..
TRAILER
http://tinyurl.com/mdkgx9q
It's actually easy to understand which is a plus with Time Travel movies... But you still come away shaking yer head going, "W.T.F!???"
I can't say much more because anything I say would likely be a spoiler.. But it's a major mind-frak...
"That's why I hate time travel. It gives me nosebleeds."
-Geordi LaForge
Trust me, you won't be disappointed...
Michale
M-
Have you seen Fury? I think its the best WWII movie since Private Ryan. The tracers and battle damage are CG, but the tanks are real. The Tiger is a 1942 veteran of North Africa (Bovington collection), the Shermans are diverse models, but its close enough. They actually ran these antiques through the mud.
The movie gets the asymmetrical tank strategies of the US and Germany about right. Defeating one Tiger with 4 or 5 Shermans would be a pretty good day for the Allied side, and leave a lot of burning Shermans.
The climax is tactically improbable, but good drama.
Chris,
Just curious as to why you say you avoid quoting Tom Friedman ...
I know there is quite a lot of criticism of his work out there and I don't fully understand where it all comes from but, I do enjoy reading his stuff!