
Obama Poll Watch -- January, 2011
Obama's best month ever
Obama poll-watchers have been waiting to see a "bump" upward in public opinion job approval ratings pretty much ever since he took office. In two years, there really hasn't been one. Until now.
In January, President Obama's approval rating went significantly higher, while his disapproval rating continued a trend of dropping with a big spike downward. What both of these meant, taken together, is that Obama is once again "above water" in the polls, with his approval rating beating his disapproval rating. This hasn't happened since last June. But, in reality, Obama has pretty much erased his past entire year's slow slide in poll numbers -- in a single month. Obviously, he didn't hit an all-time high in absolute numbers, but still, when taken month-to-month, January, 2011 was Obama's best month of his entire presidency. Not only did he finally get his bump -- but it was a truly significant bump.
Let's take a look at the chart:
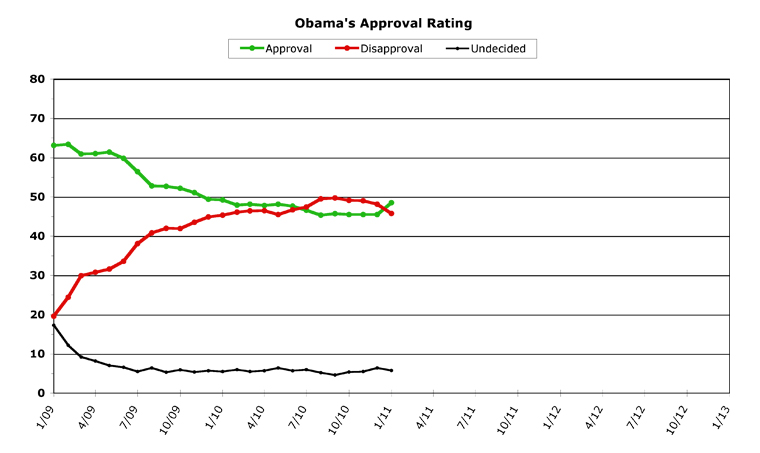
[Click on graph to see larger-scale version.]
January, 2011
Obama had four things happen which helped his numbers enormously in January. The first was a holdover from December -- all of the things the lame duck Congress managed to get done after Obama cut a tax deal with the Republicans. This is really where his daily approval numbers started to climb.
Then, at the beginning of the month, the unemployment rate dropped sharply, from 9.8 percent to 9.4 percent. That's still unacceptably high, but it is also a big step in the right direction. The public reflected this by pushing Obama's poll numbers even higher on the news.
The real catalyst, however, was the tragedy in Tucson. There's always a "rally 'round the president" effect in the polls, which happens just about every time we face a national crisis -- no matter who happens to be president at the time. And Obama's handling of the situation brought almost-universal praise, from people across the political spectrum. Obama's Tucson speech reminded a lot of people why they voted for the man in the first place, and his approval ratings jumped dramatically as a result.
Right after the Tucson speech, President Obama gave his annual State Of The Union speech, which was also well-received (for the most part). The changed atmosphere in the room was a key factor, with mixed seating and no duelling partisan standing ovations. Obama didn't gain much from this speech in the polls, but he did solidly hang onto the spike upwards from the Tucson speech ("rally 'round the president" bumps are notoriously short-lived, at times). He has been holding steady at a much higher level as he heads into February, and his prospects look good for posting further gains next month.
For the month of January, Obama charted 48.5 percent approval -- up an astonishing three full points over his previous month. At the same time, he posted a disapproval rate of only 45.7 percent -- down a similarly-astonishing 2.4 points. His "undecided" numbers went down slightly from last month's high, to 5.8 percent. For both approval and disapproval, this is the biggest positive change month-to-month Obama has ever charted. By far -- his change in disapproval is almost two-and-a-half times better than his previous "best" month; and his change in approval is seven-and-a-half times as big as his previous record in this category.
As I said, this has been the best month in terms of change-over-time that Obama has ever seen, and has reset his standing with the public back at least a full year (if not even further). That's a pretty good month, all around.
Overall Trends
The overall trends for President Obama are excellent. He started his climb in the daily polls in mid-December, entered January in good shape, and then climbed consistently throughout almost the entire month. He hit a plateau around the time of the State Of The Union, but the level he hit is even higher than the monthly average on the chart shown above. What this means is that he enters February already at a high point, and if he manages to just stay even during the month, he'll post significantly better numbers for both approval and disapproval next month as well. The trendlines are in Obama's favor, in other words.
Obama entered the month at what would prove to be his lowest point of the month in approval, at 45.4 percent. This jumped quickly to over 46 percent, and then shot upward after the Tucson news broke to 49.0 percent. From this point on, Obama never posted lower than 48.3 percent, and ended the month at 50.7 percent (after briefly hitting 51.0 percent). In one month, his daily numbers changed over five percent -- something Obama has never managed to do (in a positive direction, at least -- he has had worse changes downward, back in July and August of 2009).
Obama's disapproval numbers followed a similar (but opposite) course during January. Starting from 47.9 percent, they hit a high of 48.8 percent very early in the month and then fell steadily to a low of 42.8 percent one day before the end of the month. This is a full six-point swing in a single month -- the best Obama's ever done, by far. Obama's lines crossed on the twelfth of the month, which you can see at RealClearPolitics.com, on their daily rolling average tracking chart.
Obama's monthly average showed a dramatic change as the lines crossed over. Obama went from being 2.6 points "underwater" in December to being 2.8 points "above water" in January. These numbers are even more startling on the daily chart, where Obama entered the month 2.5 percent underwater and went on to hit a high of 8.2 points above water on the twenty-fifth of the month -- a number Obama hasn't managed since November, 2009. In fact, looking at the daily graph, Obama seems to have reset his standings right back to November, 2009.
The magnitude of the change Obama has managed in the past month deserves mention, as well. Here are the records for the six months that Obama has managed any improvement in his approval ratings, since he began his term over two years ago (month-to-month changes listed):
0.3% -- 2/09
0.1% -- 4/09
0.4% -- 5/09
0.2% -- 3/10
0.3% -- 5/10
0.4% -- 9/10
Add them all up and you get a grand total of 1.7 percent improvement, in his first two years in office. Last month, he gained 3.0 points.
Disapproval numbers are similar. For the past two years, here are the five months Obama posted lower disapproval numbers for the month, in terms of how much they changed for the better:
0.1% -- 10/09
1.0% -- 5/10
0.6% -- 10/10
0.1% -- 11/10
0.9% -- 12/10
Last month, Obama lowered his disapproval by 2.4 points.
Pretty much any way you look at it, Obama had a great month. So why don't we look at it through a magnifying glass? Here is Obama's past year, charted with wildly exploded vertical scale (which has, up until now, been almost necessary to see the tiny changes):
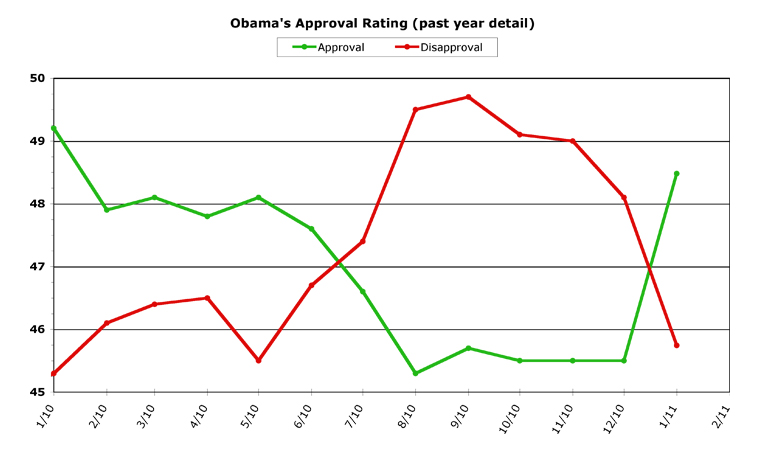
[Click on graph to see larger-scale version.]
Boy, that's a pretty nice chart, isn't it?
Even in the monthly averages shown here, Obama has reset his polling back to last January -- gaining in one month what he lost in a whole year.
With this turnaround in trendlines, Obama did not post any all-time highs or lows in either approval or disapproval. If the trend continues, or if his numbers even hold steady, he won't post such an all-time number for some time in either direction. But whatever the future brings, Obama's daily and monthly all-time records remained unchanged in January (as they have since last October).
February is going to be a contentious month in Washington, as the budget battles begin in earnest. Also, the polling still isn't reflecting the news from Egypt and Tunisia, which could have an impact on Obama's numbers, depending on how things play out. Right now, Obama is positioned extremely well at the beginning of February, but that could change quickly, especially since the lines are so close to the crossover point. Many presidents have gone back and forth in this numeric range, and it remains to be seen whether Obama can consolidate his gains next month, inch his numbers even higher, or see his bump come crashing back down. The trendlines are good, but the trendlines aren't always right, in the end.
Past Parallels
Since this article is running a wee bit long this month (insert your own "How can you tell?" joke here), let's just take a quick look at two former presidents and how Obama measures up to them. First is Ronald Reagan, whose numbers Obama has been eerily tracking for some time now:
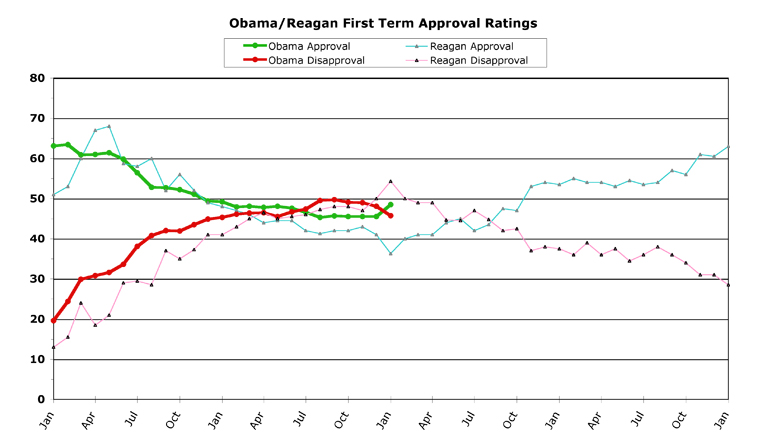
[Click on graph to see larger-scale version.]
As you can see, Obama is beating the Gipper as their trendlines finally end their almost-lockstep similarity. Reagan hit the lowest numbers he would ever hit during this month (relative to when he entered office) -- a low of 36.3 percent approval. Obama avoided this post-midterm-election dip, and for the past two months has visibly bested Reagan's numbers.
In fact, from the perspective we now have, it might be better to draw parallels with Bill Clinton's first term, instead:
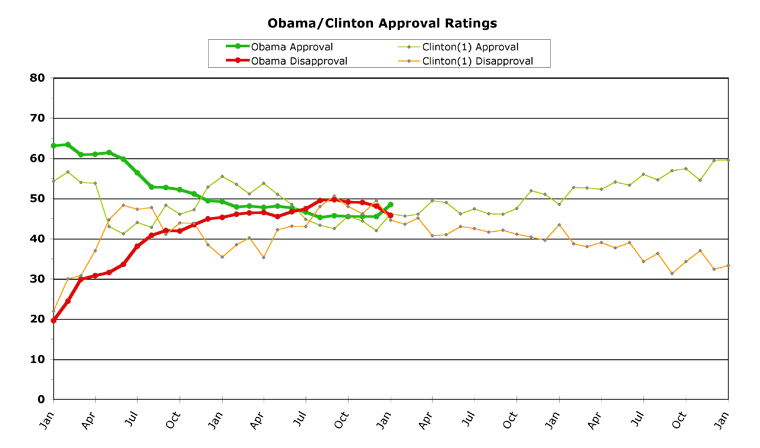
[Click on graph to see larger-scale version.]
Clinton started his "comeback" around the same time as Obama. For the rest of his term, as the economy improved, Clinton steadily improved his numbers until his re-election. It's still a little early to say that Obama's going to follow the same course, but I thought it was at least worth a quick look.
[Obama Poll Watch Data:]
Sources And Methodology
ObamaPollWatch.com is an admittedly amateur effort, but we do try to stay professional when it comes to revealing our sources and methodology. All our source data comes from RealClearPolitics.com; specifically from their daily presidential approval ratings "poll of polls" graphic page. We take their daily numbers, log them, and then average each month's data into a single number -- which is then shown on our monthly charts here (a "poll of polls of polls," if you will...). You can read a much more detailed explanation of our source data and methodology on our "About Obama Poll Watch" page, if you're interested.
Questions or comments? Use the Email Chris page to drop me a private note.
Column Archives
[Dec 10], [Nov 10], [Oct 10], [Sep 10], [Aug 10], [Jul 10], [Jun 10], [May 10], [Apr 10], [Mar 10], [Feb 10], [Jan 10], [Dec 09], [Nov 09], [Oct 09], [Sep 09], [Aug 09], [Jul 09], [Jun 09], [May 09], [Apr 09], [Mar 09]
Obama's All-Time Statistics
Monthly
Highest Monthly Approval -- 2/09 -- 63.4%
Lowest Monthly Approval -- 8/10 -- 45.3%
Highest Monthly Disapproval -- 9/10 -- 49.7%
Lowest Monthly Disapproval -- 1/09 -- 19.6%
Daily
Highest Daily Approval -- 2/15/09 -- 65.5%
Lowest Daily Approval -- 10/17/10 -- 44.2%
Highest Daily Disapproval -- 9/26/10 -- 51.2%
Lowest Daily Disapproval -- 1/29/09 -- 19.3%
Obama's Raw Monthly Data
[All-time high in bold, all-time low underlined.]
Month -- (Approval / Disapproval / Undecided)
01/11 -- 48.5 / 45.7 / 5.8
12/10 -- 45.5 / 48.1 / 6.4
11/10 -- 45.5 / 49.0 / 5.5
10/10 -- 45.5 / 49.1 / 5.4
09/10 -- 45.7 / 49.7 / 4.6
08/10 -- 45.3 / 49.5 / 5.2
07/10 -- 46.6 / 47.4 / 6.0
06/10 -- 47.6 / 46.7 / 5.7
05/10 -- 48.1 / 45.5 / 6.4
04/10 -- 47.8 / 46.5 / 5.7
03/10 -- 48.1 / 46.4 / 5.5
02/10 -- 47.9 / 46.1 / 6.0
01/10 -- 49.2 / 45.3 / 5.5
12/09 -- 49.4 / 44.9 / 5.7
11/09 -- 51.1 / 43.5 / 5.4
10/09 -- 52.2 / 41.9 / 5.9
09/09 -- 52.7 / 42.0 / 5.3
08/09 -- 52.8 / 40.8 / 6.4
07/09 -- 56.4 / 38.1 / 5.5
06/09 -- 59.8 / 33.6 / 6.6
05/09 -- 61.4 / 31.6 / 7.0
04/09 -- 61.0 / 30.8 / 8.2
03/09 -- 60.9 / 29.9 / 9.2
02/09 -- 63.4 / 24.4 / 12.2
01/09 -- 63.1 / 19.6 / 17.3
Follow Chris on Twitter: @ChrisWeigant
-- Chris Weigant


interesting numbers indeed. maybe obama really is getting the hang of the game in washington. if that's the case, i'm a bit ambivalent as to whether or not that's a good thing.
If Obama continues to frack up the Egypt situation as he has been of late, you can expect his poll numbers to tank and tank hard...
http://www.foxnews.com/opinion/2011/02/03/egyptian-warns-united-states/
Michale.....
Michale -
OK, I'll bite.
What, exactly, would you have had Obama do differently in the past week?
-CW
I was afraid someone was gonna ask.. :D
I don't really know.. But, to be fair to me, I don't have all the intel that Obama has..
I DO know that Obama seems to be following the Jimmy Carter manual on how to conduct foreign policy..
And we know how well THAT turned out for Carter.
Time will tell if Egypt is Iran all over again...
Michale....
Holy Frak!!!!
http://www.telegraph.co.uk/news/worldnews/wikileaks/8304654/WikiLeaks-cables-US-agrees-to-tell-Russia-Britains-nuclear-secrets.html#
What the FRAK is Obama thinking!!!?????
Michale.....