
Obama Poll Watch
Welcome to the first installment in what will hopefully be a four-year (or eight, even) monthly series of articles examining President Barack Obama's job approval ratings with the public, as provided by America's pollsters. Each month we will take a snapshot of how Obama is doing, and track it for his entire term. This should give a longer-term perspective than what is currently available online, and show his relative political strength over time.
We had a lot of fun with polls and charts during the election season, and several readers have complained that they have gone through "chart withdrawal" since. This column should help them with their affliction.
Now, I am aware that many people look down their noses at public opinion polling in general, and consider it untrustworthy for one reason or another. Indeed, some consider it no better than voodoo or divination. If this describes you, then I strongly advise you stop reading now, because the rest of the column is just going to bore you or annoy you. And you've got better things to do with your time than that, right?
For those of you still with me, let's get straight to the chart, and then I'll talk a bit about where the numbers come from (and why), and what the past few months has meant for Obama.
[Click on the graph to see a larger version of it.]
The numbers on this graph come from RealClearPolitics.com. I considered other sources for the data, but settled on RCP for a few different reasons. First, they provide a chart on their site which averages recent polls, and tracks the average numbers over time on a daily basis. This allows me to use their daily numbers and not have to average the raw poll numbers myself. Secondly, they minimize the effect both Gallup and Rasmussen have on some sites, by not including every single one of their polls.
Both Gallup and Rasmussen poll weekly, sometimes even bi-weekly, which results in a flood of data from two sources -- which tends to minimize the weight of other sources when you add in every single polling number Gallup and Rasmussen provide in your averages. And Rasmussen, in particular, seems to be polling a very different group of people than most of the other polls out there. The latest poll from Rasmussen shows 57 percent approval for Obama, and a whopping 43 percent disapproval. Gallup, on the other hand, leans a bit to the other side of the average of other polls, and is currently reporting 68 percent approval and 26 percent disapproval. I wrote about this back in March (complete with graphs), which is worth reading for further discussion of the "Rasmussen Effect" (especially the update at the end, from Mark Blumenthal of Pollster.com).
This is why some people don't trust polls, it is worth pointing out. If two professional pollsters can come up with such wildly differing numbers on a basic question, then something must be wrong.
But different polls use different statistical methodology, and some are better than others at predicting (for instance) the outcome of an election. Which is where the whole "poll of polls" idea comes from, since averaging the numbers tends to smooth out such differences.
The way I get my monthly numbers is to take all of RCP's daily average numbers and then average them out for the month. Thus creating a "poll of polls of polls," so to speak. So each number in my chart is the average of the daily averages of recent polls which can be seen at the RealClearPolitics page for Obama's approval rating (mouse-over the chart to see these numbers). There are probably more professional ways to come up with such numbers, but this is the best I could come up with, so you'll have to excuse my amateur methodology.
You'll also have to excuse me for explaining it in such detail, but since this is the first one of these columns, I thought I'd get it out of the way to avoid questions about where the numbers come from.
Looking at the poll numbers themselves shows a few trends. I have to admit a few things before we start analyzing the numbers, though. First, Obama is still in his historical "honeymoon" period, so these poll numbers don't mean a whole lot at this point. Americans tend to support newly-elected presidents for a few months, and give them the benefit of the doubt during this period. So Obama's approval numbers may be slightly buoyed and may indeed go down in the coming months. This is natural, and happens with just about every president, so it should be expected.
Second, there's not a whole lot of data points to look at yet. This is why I haven't done this before now, when we have at least four points on each line to consider.
But we've got to start somewhere, so let's take a look at what the numbers are telling us.
January
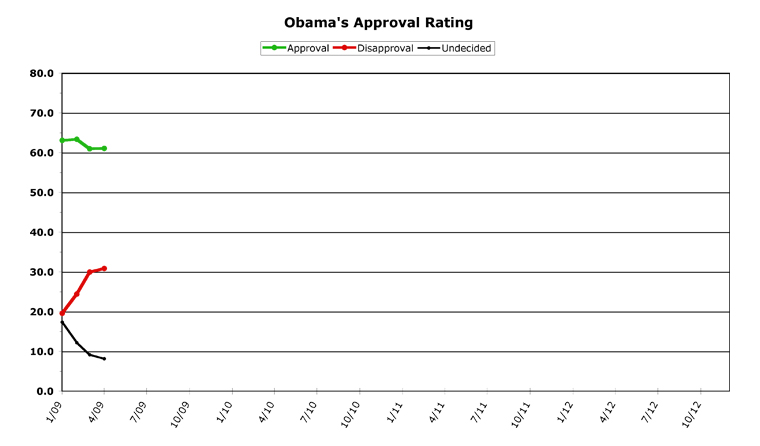
January didn't have a whole lot of poll numbers, because I am only starting from when Obama was sworn into office (on the 20th), meaning it is not a full month. Obama's approval numbers started off very high, at 63.1 percent, and his disapproval rate was only 19.6 percent. The number of undecideds was extremely high, at 17.3 percent, since many hadn't made up their minds about the new president yet.
Obama's highest daily average during January was 63.5 percent approval, and 20.0 percent disapproval. His lowest daily average was 61.8 percent approval, and 19.3 percent disapproval. Not a lot of range for either number, but then it was a short month for data.
February
Obama's first full month of polling was his best so far for approval. He ended the month with a 63.4 percent average approval, and a 24.4 percent disapproval rate, with 12.2 percent undecided. During the month, Obama's approval numbers ranged from a daily high of 65.5 percent to a low of 61.6 percent. His disapproval numbers ranged from 19.4 percent at the beginning of the month to 28.6 percent towards the end. Overall, the trend of undecided people moving into the disapproval column over time (which can be seen on a monthly basis) played out generally on a daily basis as well -- meaning the trendline within the month was pretty much the same as the monthly trendline you see on the graph.
While it is normal to expect the undecideds moving into one column or another, for the most part they seem to be moving into "disapprove." This trend will continue into March, but shows some signs of leveling out in April.
March
March was a bad month for Obama in the polls, relative to the other three months we're looking at here. Relative to presidential polling in general, it wasn't all that bad at all (ask any politician if he'd swap his poll numbers for Obama's ratings in March if you don't believe me). But it was a letdown for Obama on both fronts. His approval ratings slid 2.5 percent, and he wound up with an average 60.9 percent approval for the month. His disapproval ratings continued their climb upwards, adding 5.5 percent to finish at 29.9 percent for March. Still not that bad, but moving in the wrong direction.
This is seen more dramatically when looking at the daily numbers. Obama started off the month with his highest approval rating (64.2 percent) and ended the month with his highest disapproval rating (32.2 percent). But while his approval number went below sixty for the first time on the fourth of the month, and hit 59.8 percent, it soon recovered and spent the rest of the month in the 60.2 to 61.5 percent range. His disapproval numbers, however, continued their climb over time in the daily numbers, starting at a monthly low of 27.2 percent and marching upwards to end at the month's high. Again, this is due to undecideds shrinking to 9.1 percent for the month, down three percentage points from the previous month.
April
Things began settling down for Obama in April, however. The steep trendline for the disapproval rate was muted, and his approval numbers recovered a tiny bit. The movement of undecideds to disapprove slowed as well.
Obama's approval rate went up by a tenth of a percent in April, to finish at 61.0 percent. His disapproval went up by almost a full percent, to 30.8, but this was much better than adding five percent (as happened in February and March). Whether this has topped out and leveled off cannot be said until we get next month's numbers, but at least the slope of the line is looking better for Obama. Undecideds lost another percent, to finish at 8.1 percent, but again, this trend is slowing as well.
When looking at the daily numbers, there was movement in Obama's direction all month. He hit his highest approval number, 62.8 percent, on the 26th of the month, up from a low of 60.3 on the ninth. His highest disapproval rating, 32.5 percent, came on the second day of the month, but then fell back to the lowest, 29.9 by the eighth of the month.
Overall Trends
Over the last four months, Obama's approval ratings have been remarkably stable. This stability is remarkable because of all that has been on Obama's plate during this time. Republicans have been doing their best (worst?) to tear the popular president down with every chance they get, and yet his approval ratings remain solidly in the 60-65 percent range. This is exceptionally good for any politician.
The rule of thumb in approval polling goes something like this: anything over 60 percent is gold; 55-60 percent is excellent, but watch the trendlines carefully; 50-55 percent is good, but the closer to 50 the more worrisome; 45-50 is a warning sign of slipping support, 40-45 is dangerously close to falling off a cliff; and anything below 40 percent is "Nixon/Dubya" territory. Others may define these ranges somewhat differently, but it's generally agreed upon that from 45-55 percent is dangerous territory, but anything outside that shows the country either supports you or does not support you in general.
By this measure, Obama doesn't have much to worry about at this point. But then, it could all just be "honeymoon" approval which will dissipate as time goes on. But over four months, Obama's approval only moved around by two and a half percentage points (from 60.9 to 63.4), which is extremely stable indeed.
The other numbers paint a somewhat different picture. His disapproval numbers climbed 11.2 percentage points over the period, from 19.6 to 30.8. Almost all of this came from undecided people making up their minds to disapprove of him, as the undecided numbers went down by around ten points in the same period. But both of these trends show signs of leveling off, so next month we'll be able to tell whether this is a "beginning of the term" trend or not. After all, there are only so many undecided poll respondents, so once they've mostly all made up their mind, the trend should die off.
While this column has gone over all of these numbers already, for future consistency I am including a list of data below, if you'd like to see some hard numbers. In the future, this will help keep any one month's numbers in perspective.
[Note: This series is a work in progress. What do you think so far? Is the chart too boring? In coming months, when I only have a single month of data to talk about, should I examine other trends? In other words, what else would you like to see this column cover? Let me know in the comments, or drop me an email. We aim to please.]
Data
Highest Monthly Approval -- 2/09 -- 63.4%
Lowest Monthly Approval -- 3/09 -- 60.9%
Highest Monthly Disapproval -- 4/09 -- 30.8%
Lowest Monthly Disapproval -- 1/09 -- 19.6%
Highest Daily Approval -- 2/15/09 -- 65.5%
Lowest Daily Approval -- 3/4/09 -- 59.8%
Highest Daily Disapproval -- 4/2/09 -- 32.5%
Lowest Daily Disapproval -- 1/29/09 -- 19.3%
Monthly Data
[All-time high in bold, all-time low underlined.]
Month -- (Approval / Disapproval / Undecided)
04/09 -- 61.0 / 30.8 / 8.1
03/09 -- 60.9 / 29.9 / 9.1
02/09 -- 63.4 / 24.4 / 12.2
01/09 -- 63.1 / 19.6 / 17.3
Cross-posted at The Huffington Post
-- Chris Weigant


Once again, Chris Weigant does the number-crunching I am too innumerate to do myself. Huzzah!
OK, we can talk polls.. :D
But let's put it in context.
The APPROVAL poll in and of itself amounts to nothing more than a popularity contest. And, to anyone with half a brain, it's obvious that Obama is popular.
To get the complete picture, one must also consider the polls that show the Approval/Disapproval of the various actions taken by Obama. As THOSE polls show, Americans are dead set disapproving of practically every action taken by the Administration sans one. Many of those by a 2-1 margin..
With those polls, people would understand why the percentage of those who approve of Obama has gone down, but the percentage of those who disapprove of Obama has gone up.
Michale.....
Michale -
I've heard this claim before, but have yet to see numbers to back it up. Not saying the claim isn't true, just expressing my own ignorance. You got a link to a poll showing "Americans are dead set disapproving of practically every action taken by the Administration sans one"? (And, incidentally, which one did they approve of?)
Looking at a typical poll that shows each question asked and the response rate, I find not much evidence, although they aren't asking specifically about many actions the admin. has taken, to be fair.
But, look at question 2. That, to me, is pretty broad support, with the exception of immigration (plurality support, but not majority) and the automakers bailout.
Question 5 is germane as well -- people trust Obama over the Republicans in Congress by a 60 to 21 margin. Cong. Dems didn't do much better (36), but still...
Q9 - 60% think Obama is keeping his major campaign promises.
Q11 - Obama over GOP 61/24
Q12a/13 net - 59% say economic stimulus will help or has helped, 38% think it has hurt or won't help.
Q22 is the true "popularity contest" as opposed to Obama's job approval numbers, which are about the actual job he's doing.
Q23 shows "warm and fuzzy" qualities of Obama, and the numbers are astoundingly high.
Q25 is about a specific Obama policy - meeting with foreign leaders. 71% approve, 27% disapprove.
Q29 shows weaker support (but a majority nonetheless) for the torture memo release.
I predict you'll like Q30.
But even Q31 squeaked out a majority.
Q34 - is Obama "too liberal" or "too conservative" or "about right"? 62 percent say "about right."
The rest of the questions, until the party affiliation at the end, are about issues Obama hasn't even tackled yet (gun control, gay marriage, marijuana legalization, etc.), and so aren't really relevant (although the answers are interesting) to talking about Obama yet.
So, if this poll is so wildly wrong, please point me to one that shows what you're talking about. Because I just don't see it, personally.
-CW
Michale -
OK, it's killing me, which one issue are you saying Obama got approval for?
I'm thinking "Bo the dog" personally, but I could be wrong.
Either way, it's bugging me, so please end my confusion!
:-)
-CW
Osborne Ink -
Much like the election season, I am starting this series because I went looking for a graph of this type and couldn't easily find it. I wanted to see numbers over time, and the only thing I found was a very short-term chart. So it was largely my own tinkering around, which then led to "I bet if I'm looking for this that there are others who would like to see it too" and voila, another column series is born.
The number-crunching is actually pretty minimal, it's just putting it into a chart we can all easily reference that does the trick!
OK, I admit it. I'm a geek who likes charts. Sue me!
:-)
-CW
Far be it from to cause ya any consternation... At least any MORE... :D
Americans overwhelmingly approved of Obama's actions with regards to the Somali pirates. His "Weapons Free" order was viewed very favorably..
I'll get the info on the other polls I mentioned. Just wanted to ease your suffering as soon as possible. :D
Michale.....
"Americans do not, however, like the Obama administration's decision to retire the word "terrorism" in favor of the more abstract "man-caused disaster" terminology. Fully three-quarters (75 percent) think "terrorism" better describes the threat to the country. Only 14 percent believe that "man-caused disaster" is a more accurate description of the threat America faces. Almost seven in ten Democrats (68 percent) agree that "terrorism" is the more appropriate term to use."
http://www.foxnews.com/story/0,2933,512221,00.html
"Just 27 percent of Americans think elected officials in Washington are part of the solution when it comes to improving the economy, while 61 percent think they are part of the problem. Republicans (75 percent) and independents (66 percent) are more likely than Democrats (46 percent) to think politicians are part of the problem."
http://www.foxnews.com/story/0,2933,485147,00.html
Unfortunately, I can't find the specific article I quoted from that laid out all the polls. I knew I shoulda BM'ed it!! :D
Further, it WAS a week or two ago (or maybe longer), so things might have changed since then..
Time will tell if reality bears out the poll numbers. The cynic in me doesn't think that will happen... :D Admittedly, my prognosticational track record ain't the best, so we'll see... :D
Michale.....
As an aside....
R.I.P. Dom DeLuise
Though best known for movies like CANNONBALL RUN and BLAZING SADDLES, I loved him best as the irrepressible URGO in an episode of STARGATE SG-1.
He will be missed...
Michale.....
Michale -
The pirates, that makes sense. Hard to be against success. I still maintain that if things hadn't worked out so perfectly, a lot of the same people would now be condemning Obama for his action (from the right AND the left, incidentally). But thankfully, those snipers did a heck of a job.
As for what you cited, the first one seems like a semantic debate rather than a true rejection of an Obama policy. And the second one seems a bit vague -- I bet under pretty much ANY president people would agree with "Washington is the problem," but I have nothing more than gut feeling to back that assertation up, I freely admit.
My sense is that people feel uneasy about the Wall Street bailouts, but at the same time are kind of waiting to see the result. Most people (myself included) simply do not understand economics or the financial industry, and have to trust someone else to do the right thing. Sometimes we (and the politicians) trust the wrong people, but you really can't tell until after the fact.
If Obama's actions on the economy are seen, oh, say... six to nine months from now... to "have worked" then I think 2010 is going to be another banner Democratic year. If, on the other hand, they are seen to "not have worked" or even "made things worse" then Dems will probably lose a bunch of seats in 2010.
Notice I said "seen to have worked"/"seen to not have worked" and not "have worked"/"have not worked". In this arena, where it's almost impossible to prove what "caused" either ups or downs, it's all about the perception.
That's a long way of saying "the jury's still out" on Obama's policies. My gut feeling is that Americans WANT to trust Obama, and for the time being do trust him, but that that trust could disappear pretty quickly if things turn sour. Once we get a few more months down the road, the honeymoon will wear off and people will start judging Obama on his economy, rather than the Bush economy he inherited. His poll numbers will likely come down at that point, but whether they come down only five points or so, or whether it is a bigger drop, that remains to be seen.
Again, that's just a gut feeling, though.
What astonishes me is how Republicans are doubling down on Obama failing. Just once, I'd like an interviewer to ask a Republican "But what happens if Obama's plans work, and the economy recovers quickly? What will your party do then?"
But I'm not holding my breath waiting for it.
-CW
That's a long way of saying "the jury's still out" on Obama's policies. My gut feeling is that Americans WANT to trust Obama, and for the time being do trust him, but that that trust could disappear pretty quickly if things turn sour.
That's pretty much how I feel in a nutshell..
I WANT to believe in Obama and WANT to believe he is being completely altruistic in his actions. To a certain extent, I believe he is.. But the cynic in me knows that the Democrats are NOT on the same page as Obama...
What astonishes me is how Republicans are doubling down on Obama failing. Just once, I'd like an interviewer to ask a Republican "But what happens if Obama's plans work, and the economy recovers quickly? What will your party do then?"
Funny.. That's what the Republicans asked of the Democrats regarding Bush's policies in Iraq...
Guess what? The policies worked.. And now the Democrats are falling over themselves trying to take credit for it. Or, at the very least, ignoring it.
Michale.....