
Obama Poll Watch [August 2009] -- Obama's Base Support Erodes
Welcome back again to our ongoing series of beginning-of-the-month looks at President Barack Obama's approval ratings in the public opinion polls. As always, I feel the need to state up front that if you're one of those people who either: (a) doesn't believe any polls, because they're all voodoo; or (b) doesn't believe polls which don't tell you what you want to hear, because they're so plainly biased; then I strongly -- strongly -- urge you to spend your precious time reading something else. Because you're just going to wind up annoyed, one way or another, by reading this. Consider yourselves warned.
So, with the standard disclaimer aside, we can delve in to Obama's poll numbers for August. The news for Obama fans continues to be bad, unfortunately. There may be a faint glimmer of a spark of hope in the numbers -- but that's about all I can promise here, sorry about that. Obama's approval numbers continued their downward trend this month, and his disapproval numbers also increased. We'll go into these numbers in detail, up front.
Afterwards, continuing our series of looking at Obama's approval numbers through the lens of previous presidents' records, we will take a look at Obama as compared to President George W. Bush. Last month we highlighted Bush's first term numbers, and this month we will do the same for Bush's second term -- which, it should be noted, is a much more agreeable enterprise for Democrats to contemplate. Now, logically, we should have looked at Bush v. Obama before we looked at Clinton v. Obama, but the data for Clinton were easier to manage, so that's just kind of the way it happened. As Groucho Marx was wont to say: "Time flies like an arrow. Fruit flies like a banana." Ahem.
Which brings us, in a roundabout way, to the "shamelessly plug your website" part of the program. Last month we introduced our new site (well, "page on my site for now" is currently technically more accurate) to keep track of Obama's poll numbers (and, of course, these columns) all in one convenient and easy-to-remember-the-URL type of place: ObamaPollWatch.com. This month, we spent some time making it look a little better than just a rickety placeholder of a web page, and have now organized the charts so they're more understandable and easy to reference. So go check it out, and check back every month for updates!
But enough of all this housekeeping, let's get to the polls, and (more importantly) the charts, starting with Obama's August numbers update:
[Click on graph to see larger-scale version.]
August 2009
August, like the July which preceded it, wasn't all that great a month for Obama.
The first thing that happened in August was everyone went on vacation (including myself, I have to admit). But it was not to be an idyllic retreat to home districts for members of Congress. The "town hall" meetings traditionally given over this summer break are usually tepid affairs, drawing a few dozen people who either care passionately about politics or are trying to get some sort of problem with the government resolved. The local news usually doesn't even bother to cover such meetings (to say nothing of the national news) because they are such sleepy, non-newsworthy events.
That all changed this year. People showed up by the hundreds, even at times by the thousands. And they shouted that they wanted to be heard. In fact, they shouted so much that nobody heard much of anything. Substantive discussions of issues and positions fell by the wayside, as the media gleefully shone the spotlight on the loudest and rudest of the town hall protesters.
Democrats suffered during these meetings, from their own short-sightedness. If they had passed a bill in the House and a bill in the Senate (as Obama asked them to) before the break, then at least they could have defended it as a solid piece of legislation. Instead, confusion reigned. "Obamacare" doesn't exist, at this point, and there are so many moving targets with the bills from various different congressional committees that defending any one of them is like trying to nail Jell-o to the wall. Which is why, as summer ends, the only thing the public can largely agree upon about healthcare reform is that they're confused by the whole process.
Obama himself wouldn't even come out for or against any of the bills, and his approval ratings have suffered as a direct result. Obama was valiantly trying to salvage bipartisanship, but the bipartisanship had already sank beneath the waves of the political storm. But it has taken Obama so long to give up the good ship U.S.S. Bipartisan that he began losing support from his own base as a result.
And then, at the end of the month, Teddy Kennedy died. Kennedy was supposed to be the leader of the healthcare reform battle, and his death was symbolic in the midst of the unfinished healthcare reform fight.
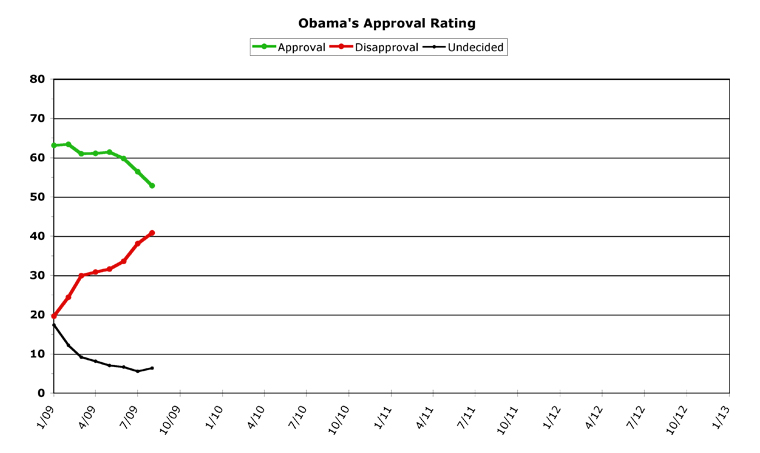
All of these things have taken their toll on Obama's numbers. Obama's approval rating last month took its biggest dive yet, as we measure them here, and fell 3.6 percent to an average of 52.8 percent for the month. While his approval rate hit this new low, his disapproval rate hit a new high, up 2.7 percent from last month to an average of 40.8 percent for the month of August. For the third straight month, Obama's approval hit a new low, while his disapproval hit a new high -- not exactly a positive direction for his numbers to be taking.
But these numbers bear a little deconstructing. Because while the news is undoubtedly and unarguably bad for Obama, it may not be as bad as it seems, when examined closely. Then again, it may actually be worse. We'll get to all that in a minute, in the Trends section, but for now here's the rest of the bad news. Obama's numbers held to pretty much the same pattern they exhibited last month -- as time went by, his approval numbers generally dropped, and his disapproval numbers generally rose. Obama's daily approval rating hit its highest average (54.2 percent) on the third of the month (then dropped a fraction, and regained the 54.2 percent high on the seventh and eighth of the month), but then headed slowly downward to hit a low of 51.2 percent on the 20th of the month (which also fluctuated upwards briefly, but then ended up for the month at this low point of 51.2 percent). His disapproval rating average hit a low of 38.6 percent on August fourth, early in the month; but then steadily rose to hit the month's high of 42.4 percent on August's final day.
The question for September is, obviously, whether Obama can reverse this slide or not. But, as I said, he may already be doing so.
Overall Trends
First, let's take a look at the scope of the slide, and put Obama's numbers in a little context. Obama's approval rating is edging towards the lower side of 50 percent, but has not fallen through this milestone yet. The 40-60 percent range is where most presidents' approval ratings generally reside throughout their term, in normal times. Above 60 percent, the president is golden and knows he has a healthy majority of the citizenry behind him. Below 40 percent, astute presidents hunker down in the White House, knowing that something has gone seriously wrong with the direction of their leadership. But between 40 and 60 percent is a zone of fluctuation. In the range of 60 to 55 percent, things are still pretty good and, while the numbers could be improved, they are nothing (much) to worry about. From 55 percent down to 50 is the danger zone where presidents can feel their support slipping away, and are hanging on to a majority with their fingernails. From 50 to 45 percent, presidents know they're losing the battle for approval. And from 45 to 40 percent is usually where big changes are announced (such as the firing of a highly-placed White House official, for instance, to "shake up the administration") in a desperate move to get the numbers moving back up again.
There's another easy-to-spot point where presidents truly begin to worry -- when their approval number line and their disapproval line cross. If disapproval numbers are higher than approval numbers, then more people are against you than are for you. Psychologically, this is a big deal. This crossover usually happens within the 40-50 percent range (there are always a few "undecided" responses, which is why it's usually below exactly 50 percent).
Bill Clinton's lines crossed four months into his term, and stayed upside-down for three more months, until he was able to reverse the slide. Obama's numbers right now are a lot better than Clinton's were at the same point in his term (see the graphs on ObamaPollWatch.com). George W. Bush's lines didn't cross until the last year of his first term, but then stayed crossed for his entire second term (graphs are below).
To put it into a different kind of perspective, Obama's approval number right now is almost exactly the proportion of people in this country who voted for him. After he was sworn in, his numbers were around 10-15 percent higher than the number of people who voted for him, and have now fallen back to just everyone who pulled the Obama lever on election day.
This is oversimplification, I admit. But my chart itself is an oversimplification, since it only tracks the monthly average of a "poll of polls" daily average. On the chart, the slope of the approval line for the past two months looks pretty steady, and pointed decidedly downward. But this doesn't show the real picture. Obama actually lost most of his ground in July, and the rate of decline for his approval ratings has actually slowed considerably in August (which is admittedly impossible to see, because of the way the chart was designed). In July, the difference between Obama's highest daily approval (on the first day of the month) and his lowest daily approval (on the next-to-last day of the month) was 6.1 percent. This month, the difference between his high and low numbers was only 3.0 percent. His disapproval line on the graph actually shows a bit of this, as the slope decreased this month. In July, his disapproval ratings spanned 7.3 percent (from low to high), but in August it was only 3.8 percent.
Meaning the dip in the polls may indeed be bottoming out for Obama. Or at least leveling off. Now, everything is always in constant motion, so I have to admit that his numbers could only be pausing before taking a real turn for the worse. Which would put him below 50 percent approval pretty fast, and reach into line-crossing territory for the first time.
The really worrisome thing for Obama is that most of the loss of support this month can be traced to Democrats. Obama's numbers from Republicans and Independents didn't change much at all, but he is losing significant support among his Democratic base. And losing your base is always problematic for any politician. John Zogby just pointed this out, as have others who follow polls closely. Democrats are becoming disillusioned with Obama, and are waiting for him to stand up and fight on healthcare reform. They're waiting, to be blunt, for Obama to lead. Obama has realized this, and is about to address a joint session of Congress next week. But just standing up and giving a moving speech is not going to be enough, at this point. If Obama comes out and strongly stands up for very specific options next week, it could turn things around for him. But if he gives an hour-long speech while saying nothing very new, it could be the point future historians point to when they say, "here's where the healthcare reform effort truly failed in 2009."
In other words, September could be a game-changing month for Obama. If he can manage to at least flatten the curves out and hold his ground during September, he'll probably consider it a good month.
Obama v. George W. Bush
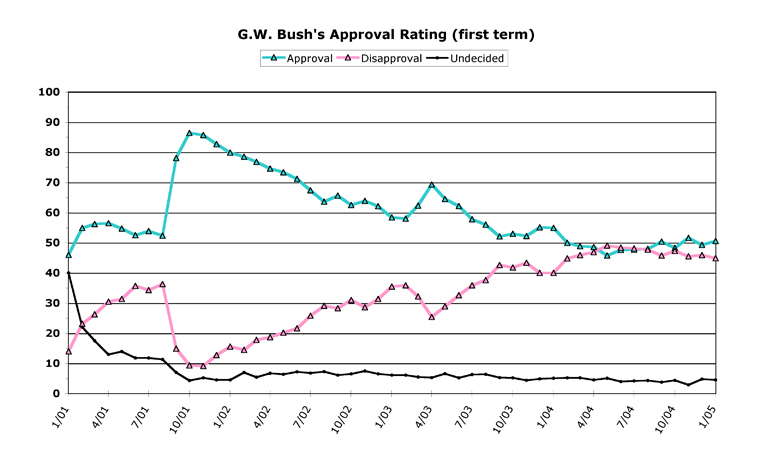
This actually worked out, quite unintentionally I assure you, as the best month to compare Barack Obama and George W. Bush's early presidencies. The biggest reason, of course, is the undeniable fact that for a few years after the events of 9/11/01, George Bush was the recipient of an extraordinary "rally 'round the chief" surge in his poll numbers. Americans, both when at war and especially when attacked, exhibit this natural human trait to group together, and it was reflected (in record-breaking numbers, to give credit where credit is due) in Bush's poll numbers for years thereafter. Not until Bush showed such indifference towards New Orleans being drowned by Hurricane Katrina did his numbers slip into truly unrecoverable territory. But, realistically -- and optimistically (hoping, of course, that no future event gives any sort of comparison to 9/11 in the public's opinion of their leader) -- for a few years immediately after 9/11/01, Bush's poll numbers should be seen as an anomaly, and not valid for realistic comparison to other occupants of the Oval Office. Which leaves us precisely where we are this month -- with Bush's numbers pre-9/11 as the last mile marker to measure these things by for a while.
For a quick review, let's take a quick look at Bush's first term. This was covered in more detail last month, but we'll throw up the graph again, just to remind everyone. This chart is also an anomaly, because the scale had to be expanded from "0-80 percent" to "0-100 percent," just to be able to handle Bush's sky-high approval numbers after 9/11. A hint: remember the colors for later.
[Click on graph to see larger-scale version.]
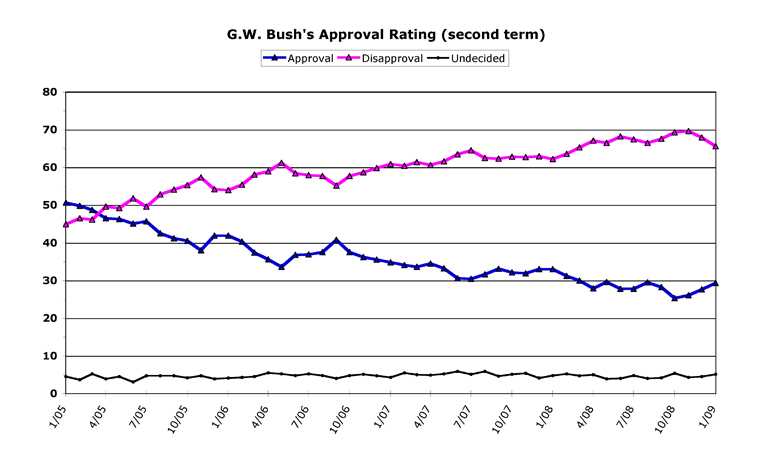
Now let's take a look at our new historical graph for this week, President George W. Bush's second term. At first glance, this seems like a pretty good graph for any politician to see. Until, that is, you take a close look at the key.
[Click on graph to see larger-scale version.]
Because that general upward trend is, of course, for Bush's disapproval numbers, and that steady slide downwards is his approval numbers. Again, I ask you to remember these colors for later.
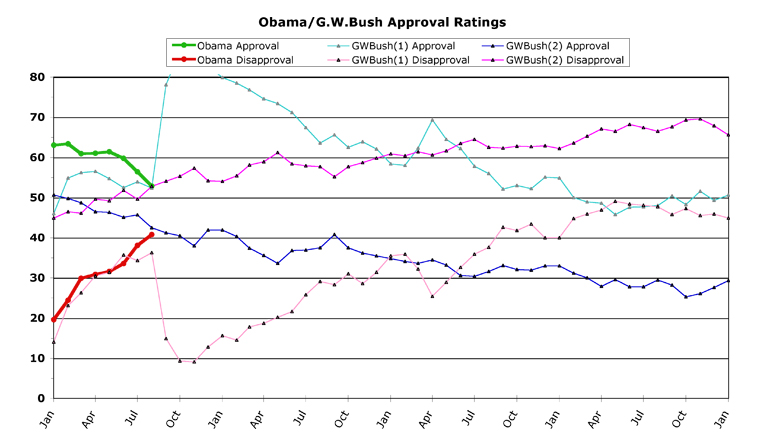
Now let's take a look at Obama's numbers versus Bush's, at this point in their respective presidencies:
[Click on graph to see larger-scale version.]
The first thing you notice about this graph is that Obama's approval (52.8 percent) is almost exactly the same as Bush's (52.4 percent) in his first term. Obama's numbers started a lot higher, so they had farther to fall, but at this point Obama and Bush are just about even. Obama's disapproval number is 4.5 points higher than Bush's at this point in his first term, though. For further comparison, Obama's approval is exactly ten points higher than Bill Clinton's was (42.8 percent) at this point.
But we're supposed to be looking at Bush's second term here. The lines get a little confusing, which is why I used the same colors as the previous charts to help. Bush's second term was an unmitigated disaster in the polls. At this point in his second term, Bush's numbers are almost exactly even with Obama's numbers -- if you flip Bush's chart over. Bush has exactly the same 52.8 percent as Obama, except Obama's number is his approval, and Bush's is his disapproval rate. And Obama's disapproval is less than two percent lower than Bush's approval rate at this point in the term.
So things could be worse. Bush's numbers, bad as they are for this month in his second term, would actually never again reach such heights. His approval sank through 40 percent (around the time of Katrina), and then 30 percent, never to recover. Few presidents have ever posted approval numbers in the 20s. Nixon and Truman come to mind, but that's about it. And by the end of his second term, Bush's disapproval rate almost hit the stratospheric number of 70 percent.
Bush's second term will be useful to pollsters in the future as "the best bad example" -- the low mark to measure all other presidents' polling lows against. That's my educated guess, anyway.
[Obama Poll Watch Data:]
Column Archives
[The full Obama Poll Watch column archive. This column posts the first Monday or Wednesday which follows the start of a new month. Since each column covers the previous month's data; these links are listed by the month each article covers, and not the month when they were actually published. For example, an article listed as "June" would really have been published in July, but it covers the data for the month of June.]
[July 09], [June 09], [May 09], [Apr 09], [Mar 09]
Obama's All-Time Statistics
Monthly
Highest Monthly Approval -- 2/09 -- 63.4%
Lowest Monthly Approval -- 8/09 -- 52.8%
Highest Monthly Disapproval -- 8/09 -- 40.8%
Lowest Monthly Disapproval -- 1/09 -- 19.6%
Daily
Highest Daily Approval -- 2/15/09 -- 65.5%
Lowest Daily Approval -- 8/20/09 -- 51.2%
Highest Daily Disapproval -- 8/31/09 -- 42.4%
Lowest Daily Disapproval -- 1/29/09 -- 19.3%
Obama's Raw Monthly Data
[All-time high in bold, all-time low underlined.]
Month -- (Approval / Disapproval / Undecided)
08/09 -- 52.8 / 40.8 / 5.5
07/09 -- 56.4 / 38.1 / 5.5
06/09 -- 59.8 / 33.6 / 6.6
05/09 -- 61.4 / 31.6 / 7.0
04/09 -- 61.0 / 30.8 / 8.1
03/09 -- 60.9 / 29.9 / 9.1
02/09 -- 63.4 / 24.4 / 12.2
01/09 -- 63.1 / 19.6 / 17.3
Questions or comments? Use the Email Chris page to drop me a note.
Cross-posted at The Huffington Post
-- Chris Weigant


I would think that Bush's FIRST term would be the better comparison to Obama's first term.
In Bush's first term at the corresponding date, there hadn't been any "catastrophes" (9/11, Katrina, etc etc) to skew the numbers.
Correspondingly, Obama's first term, to date, is also free of any external skewing.. I say "external" because, while it can be argued that DunselCare is a catastrophe, it is a catastrophe of Obama's own making.
Consequently, it can be logically and rationally argued that Obama's approval numbers in the here and now are no better than Bush's approval numbers at the same point in time of his first term, pre-9/11. And Obama's DISAPPROVAL numbers are actually higher than Bush's..
I tell ya, THAT'S gotta hit the Left where it hurts, eh? :D
Michale...
Chris, your consistent honesty wins you an honest weblog award.
Chris, I think you need to break down Obama's poll numbers with independents and progressives to get the full picture. Obama's lost support in the left due to uncertainty about the success of health care reform. I think they explain a lot of the softening. This was the central debate at Netroots Nation and it's the source of all the oh noes at HuffPo.
I am curious as to what ya'all think regarding Obama's addressing schoolchildren next week?
Michale.....
I swear, CW!!
The White House simply HAS to be reading your columns!!!
http://www.breitbart.com/article.php?id=D9AGJQ002&show_article=1
No other explanation fits! :D
Michale.....