
2012 Electoral Math -- Pre-Convention Baseline
As we approach the "convention season" in the race for the presidency, it behooves us to take another look at how the electoral math currently stands. Mitt Romney chose to announce his running mate rather early, which is just beginning to be reflected in the polling. But, starting next week, each party will likely get a noticeable "convention bump" in the polls. Because the two conventions are happening right after one another, this should stir the big data pot well into September. Which is why now is a good time to look at the state of the race, to establish a baseline to measure all this expected frenzied movement.
We only have time for a short column today, so we're only going to look at two charts this time around, and then quickly wrap up with my picks. I promise next time around we'll take a deeper look at what is going on. Let's begin with Mitt Romney's chart (click on either of these charts to see a bigger copy):
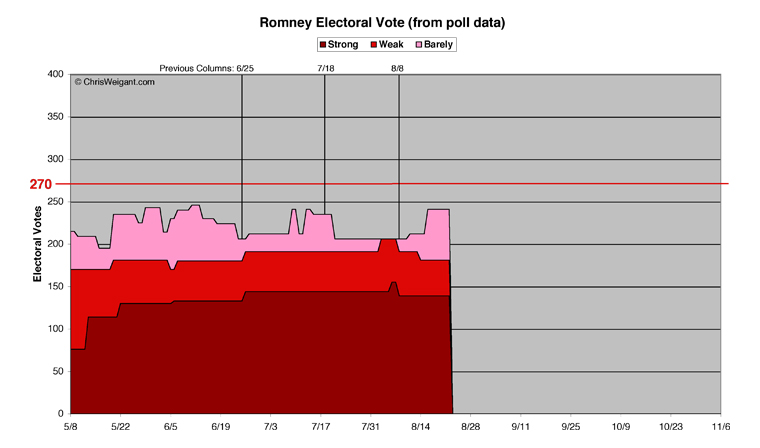
[Definition of terms: Strong means 10% or better in the polls, Weak means 5% or better, and Barely is under five percent.]
The last time we took a look at the math was two weeks ago (the vertical lines in the charts show the dates of these columns). In that time period, Romney showed some positive movement, which was dampened by some weakening. How much of this was due to the selection of Paul Ryan is anyone's guess, really.
Romney gained two pickups this time around, Iowa and Florida. This put his overall total an impressive 35 Electoral Votes ("EV") higher, but Romney also saw Missouri weaken from "Weak" to "Barely" during this period. Importantly, this was before the Missouri Republican candidate for Senate caused such a ruckus a few days ago, meaning Romney's hold on Missouri was already heading in the wrong direction before the news broke.
Because Florida is so large, this all means Romney rose from a total of 206 EV to a whopping 241. That's a pretty big jump for two weeks. The critical "Strong Plus Weak" line on that chart, however, moved downwards from 191 EV to only 181 EV, while his "Strong" number held steady at 139 EV. So far, at least, Romney's choice of Ryan has not hurt him in Florida, at least yet. Florida is crucial for Romney's chances to win, so this is good news for him.
Let's take a look at Barack Obama's chart:
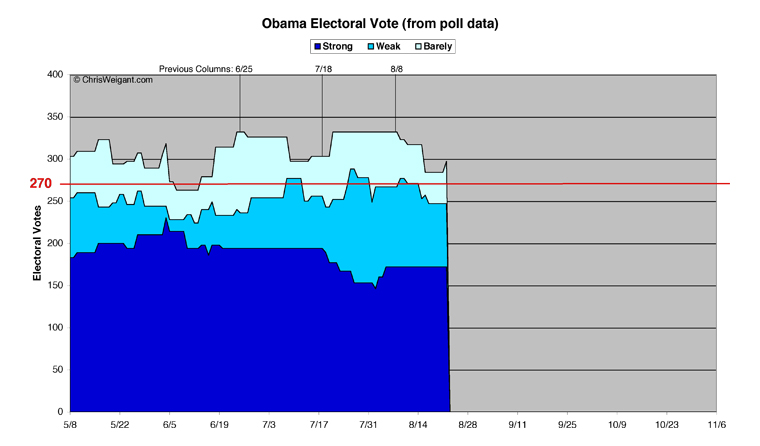
The news for Obama was mostly bad this time around. Again, this could be the bump from Romney naming his vice presidential pick, or it could be unrelated. The good news for Obama is that he managed to move Colorado back from being a tie into Barely, and New Hampshire improved from Barely to Weak. Virginia started off with bad news, moving to a tie, but then migrated back to Barely Obama again, for no net gain or loss. The worst news for Obama was losing Florida, but Florida can be expected to bounce back and forth during the whole election, and not really in either candidate's column as of yet. The loss of Iowa to Romney hurt Obama as well. Obama weakened his hold on two states, Wisconsin and Ohio, although they still are in the Barely column for him at this point. Wisconsin could become a much bigger fight than the Obama team was likely expecting, now that they've got a "favorite son" on the Republican ticket. It will be very interesting to watch the polling coming out of the state over the next month.
Obama's numbers fell overall, with the loss of Florida's 29 EV leading the trend. Obama started two weeks ago with a total of 332 EV, fell to 284 EV until Virginia firmed back up to leave him at the end with 297 EV overall. This was a net loss of the same 35 EV that Romney picked up. More importantly, while Obama's Strong number held steady at 172 EV, his Strong Plus Weak line went up slightly to 277 EV at the start, but then headed down to 247 --which translated into a net loss of 20 EV.
While both candidates' Strong Plus Weak numbers fell this time around, Obama's lead over Romney in this category has fallen from a 76 EV margin down to 66 EV -- which is still a healthy lead, at this point in the race. However, Obama has to hope that the Democratic convention will turn the trendline around for him in some key states.
My Picks
This is the part where I toss darts at the wall and try to classify states on more of a gut feeling than just raw poll numbers. To do this, I use different labels to avoid confusion. At the end of this article are full lists of states for each category (with their EV numbers), as well as a list of states which haven't been polling in a long time (so you can see which polling data is getting stale).
First we look at "Likely" states for each candidate, broken down into "Safe" and "Probable" for each. Then we get to the "Tossup" states, which are divided into "Leaning" for each candidate and then a "Too Close To Call" category, before adding it all up in conclusion.
Likely States -- Obama
Safe Obama (14 states, 179 EV)
I'm moving Oregon up to Safe Obama, just because I really don't think Romney's got a chance to win the state. The polling data isn't very recent, but my gut tells me this state is pretty safely in the Obama column.
Probable Obama (7 states, 68 EV)
Oregon moves up from Probable to Safe for Obama, and New Hampshire moves in to take its place. Now, New Hampshire may wind up being closer than I now think, but as of now it seems to be getting pretty solidly behind Obama. Perhaps I'm being too optimistic, to put it another way. If New Hampshire shows signs of weakening, then I'll move it back down, but for now my gut tells me it's at least Probable Obama.
Likely States -- Romney
Safe Romney (18 states, 148 EV)
Romney's Safe states showed no change this time around. He can rest assured that these 18 states will be showing up in red on election night.
Probable Romney (4 states, 33 EV)
Romney does lose one state here downwards, as Missouri heads into a storm of uncertainty. Missouri has been, demographically, getting redder and redder over time, so it really should be an easy state for Romney to claim, but it is showing signs of weakness already -- which happened before the Todd Akin "legitimate rape" comment controversy. Now that this has become the hot-button issue of the week, Romney's standing in Missouri could be affected by the fallout (especially since Akin appears to be staying in the race, at least for now). Either way, the state can't even be seen as Probable Romney at this point.
Tossup States
Lean Obama (2 states, 27 EV)
Obama loses three states here, one of which was good news (as New Hampshire moved up), and two of which were bad news. Both Iowa and Wisconsin have to be seen as Too Close to Call at this point, at least until Obama gets some better polling in each. In the last of these columns I wrote, I moved Iowa up to Lean Obama because I thought it was firming up for Obama, but I was wrong as it moved all the way to Romney's column this time around. Wisconsin is going to need some polling to see what effect putting Ryan on the Republican ticket is going to have. Colorado and Ohio are the only states which remain Lean Obama this time around, for a total of 27 EV.
Lean Romney (2 states, 25 EV)
North Carolina stayed in the Lean Romney column, but Missouri moved down here as Romney's numbers weakened. I almost moved the state into Too Close To Call, but will give Romney the benefit of the doubt here, at least until I see polling which indicates otherwise. Even if Akin stays on the ticket through November, it may not harm Romney's chances in Missouri. We'll see. Taken together, these two states add up to 25 EV.
Too Close To Call (4 states, 58 EV)
Florida and Virginia both remain Too Close To Call, and at least Florida may stay in this category until the very end of the race. Two states moved down to Too Close To Call this week, both bad news for Obama. Iowa and Wisconsin join the battlegroundiest of the battleground states, for a grand total of 58 EV in the category.
Final Tally
Counting up all my picks without any leaning or tossup states, Barack Obama improved by 4 EV this time around, with the addition of New Hampshire, for a total of 247 EV that seem safe for him. Mitt Romney dropped 10 EV with the loss of Missouri to close the period with just 181 EV safely in the bag for him. This widened the gap between the two to a rather impressive 66 EV lead for Obama. Obama needs 23 EV out of the remaining tossup states, whereas Romney needs to win 89 EV -- which would count as "running the table," since there are only 110 EV in the category. Romney would have to win Missouri, North Carolina, Florida, Iowa, Virginia, and Wisconsin -- and then he'd still have to take away either Colorado or Ohio from Obama in order to get over the finish line. Obama, at this point, could win his safe states plus just Colorado and Ohio and still win the race.
Of course, this could all change quite drastically in the next two weeks. It's hard for political wonks to realize, at times, but most of America simply doesn't pay much attention to political news. This begins to change during convention season. More and more of the public will start paying attention, and polling numbers can often swing wildly when this does happen. So while Obama looks in pretty good shape at this point, in two weeks he could be in a very different spot indeed. We'll be able to look back, after the conventions, and see how much has changed from today's baseline.
[Electoral Vote Data:]
(State electoral votes are in parenthesis following each state's name. Washington D.C. is counted as a state)
Barack Obama Likely Easy Wins -- 21 States -- 247 Electoral Votes:
Safe States -- 14 States -- 179 Electoral Votes
California (55), Delaware (3), Hawaii (4), Illinois (20), Maine (4), Maryland (10), Massachusetts (11), New Jersey (14), New York (29), Oregon (7), Rhode Island (4), Vermont (3), Washington D.C. (3), Washington (12)
Probable States -- 7 States -- 68 Electoral Votes
Connecticut (7), Michigan (16), Minnesota (10), Nevada (6), New Hampshire (4), New Mexico (5), Pennsylvania (20)
Mitt Romney Likely Easy Wins -- 22 States -- 181 Electoral Votes:
Safe States -- 18 States -- 148 Electoral Votes
Alabama (9), Alaska (3), Arizona (11), Arkansas (6), Idaho (4), Kansas (6), Kentucky (8), Louisiana (8), Mississippi (6), Nebraska (5), North Dakota (3), Oklahoma (7), South Carolina (9), Tennessee (11), Texas (38), Utah (6), West Virginia (5), Wyoming (3)
Probable States -- 4 States -- 33 Electoral Votes
Georgia (16), Indiana (11), Montana (3), South Dakota (3)
Tossup States -- 8 States -- 110 Electoral Votes:
Tossup States Leaning Obama -- 2 States -- 27 Electoral Votes
Colorado (9), Ohio (18)
Tossup States Leaning Romney -- 2 States -- 25 Electoral Votes
Missouri (10), North Carolina (15)
Too Close To Call -- 4 States -- 58 Electoral Votes
Florida (29), Iowa (6), Virginia (13), Wisconsin (10)
Polled, but no polling data since the primaries:
(States which have not been polled since the beginning of June, with the dates of their last poll)
Maryland (5/21), Nebraska (5/16), Rhode Island (2/22), South Carolina (1/13), Tennessee (5/9), Texas (5/13), Vermont (2/22), and West Virginia (4/28).
No polling data at all, yet:
(States which have not been polled so far this year):
Alaska, Arkansas, Delaware, Hawaii, Idaho, Kansas, Kentucky, Louisiana, Mississippi, Washington D.C., Wyoming
Electoral Math Column Series Archive:
-- Chris Weigant
Cross-posted at Business Insider
Cross-posted at The Huffington Post
Follow Chris on Twitter: @ChrisWeigant


How ironic would it be if BOTH conventions were marred by hurricanes??
Michale....
Analysis of election factors points to Romney win, University of Colorado study says...
A University of Colorado analysis of state-by-state factors leading to the Electoral College selection of every U.S. president since 1980 forecasts that the 2012 winner will be Mitt Romney.
http://www.colorado.edu/news/releases/2012/08/22/analysis-election-factors-points-romney-win-university-colorado-study-says
http://thedailybanter.com/2012/08/the-perfect-storm/
Political bigotry at it's finest..
Particularly shameful coming from a fellow Floridian....
Michale......
Well, another shooting...
Cue the Hysterical Left and Left-Wing MSM blaming the Tea Party and Republicans...
Michale.....
Another look at the UC Colorado Electoral College Prediction mentioned in #02..
http://i.dailymail.co.uk/i/pix/2012/08/23/article-2192464-14AAED23000005DC-953_634x286.jpg
An 89.2% success rate in correctly predicting Electoral College Results over a span of 30 years...
Anyone worried yet?? :D
Michale.....
Dead heat in Ohio: http://www.dispatch.com/content/stories/local/2012/08/26/tight-races-put-undecided-voters-in-control.html