
Electoral Math Charts Updated
It's time once again to take a look at the Electoral College math from state-level polling. Nationwide polls are not completely meaningless, but they are pretty irrelevant -- because that's not how we elect a president. You have to win enough states to get more than half the electoral votes in the Electoral College. While many would like to change this system, it's what we've got for the 2008 election, and so looking at the state-level polling is much more important to figure out where the race is right now, and what the trends are.
The last time I wrote about this, I listed some caveats which bear repeating here:
A few caveats, first. These graphs were created using data from the electoral-vote.com website, and I can't personally vouch for their accuracy. These are all state polls, and not national polls. Some local pollsters are better at understanding their state's demographics than the national pollsters are, and some are not. And sometimes everybody gets it wrong (see: New Hampshire Democratic primary, for instance). Polling itself may be missing people with cell phones (and no land lines), and may also be missing new voters (many polls only look at "likely voters," defined as those who have voted previously). And these state polls are only updated sporadically, meaning some of this information is months out of date. So I'm not saying that these polls are going to reflect perfectly the outcome of the vote, in other words, but then no poll can really make such a claim. But you have to use the data available, and the electoral-vote.com website has one of the better presentations of available data, so I chose to use their figures.
OK, enough caveats. Polls aren't perfect, I think we all understand that. But they can be instructive nevertheless.
First, let's start off with the percent each candidate has in the Electoral College (based on current polls, and assuming that even very close states break the way the last poll indicated). McCain is red, Obama blue, and ties are white.
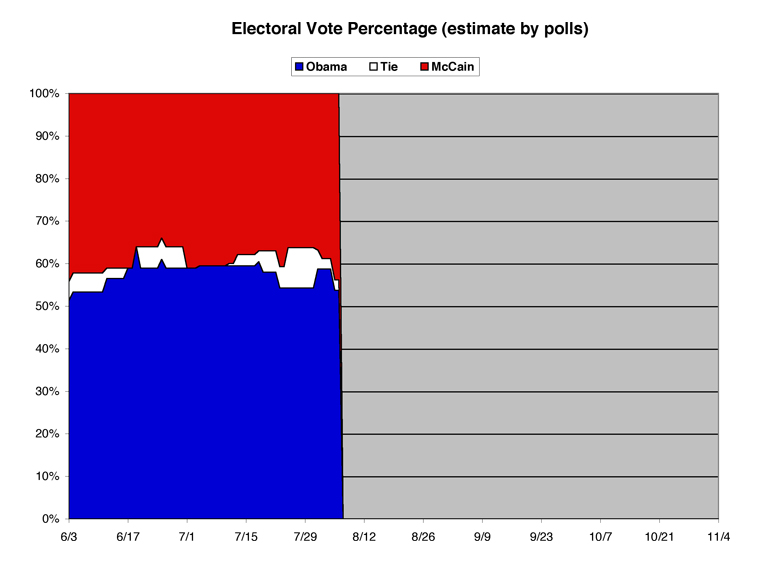
There has been some activity since the last time we looked at this (7/21/08). Obama lost some ground initially, and McCain gained some; but then there were three important states that were tied for a while (Florida, Missouri, and Virginia), which came at McCain's expense. The tied states swung one way or another, and the race has since tightened up. Initially, both Obama and McCain made gains, but this was partly due to an outlier poll showing Obama barely ahead in Florida. Florida has gone back to McCain, which is the most recent movement in the chart. Percentage-wise, Obama is down from the high 50s to the middle 50s, and McCain has improved from the high 30s to the middle 40s. Obama still leads in outright electoral votes, 289 to McCain's 236 (with Virginia's 13 still tied).
While Obama is down from where he was before, he can improve his standing considerably by flipping Ohio back into his column, with their 20 electoral votes (in the last Ohio poll, McCain is up 45 to 43).
Let's drill down into each candidate's numbers to see their relative level of support. First, John McCain.
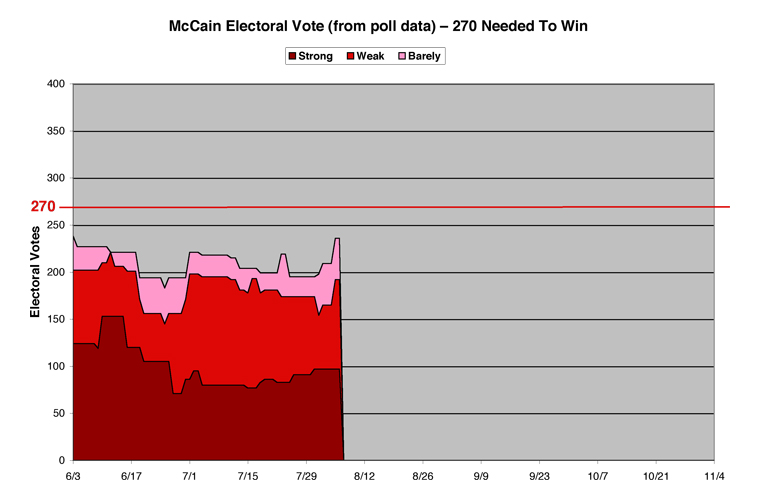
As always, these are divided into Strong (10% or better lead in the polls), Weak (5% or better) and Barely (less than 5%).
McCain's Strong support got a little better, moving from 86 electoral votes to 97. Since July 21, McCain has lost Alaska from this column, and gained Mississippi and South Carolina.
McCain's Weak support went from 95, up to 98, then stepped down to as low as 57 before bouncing back to stay exactly the same at 95. So the overall gain for fairly safe states for McCain (Strong plus Weak) goes up by 14 electoral votes, to land at 192 total.
McCain also made progress in his Barely column, mainly due to snagging both the Dakotas, Montana, and (the big one) Ohio. McCain's Barely total goes from 18 to 44. While the total is still short of the 270 he needs, that's a pretty disturbing trendline for the last few weeks.
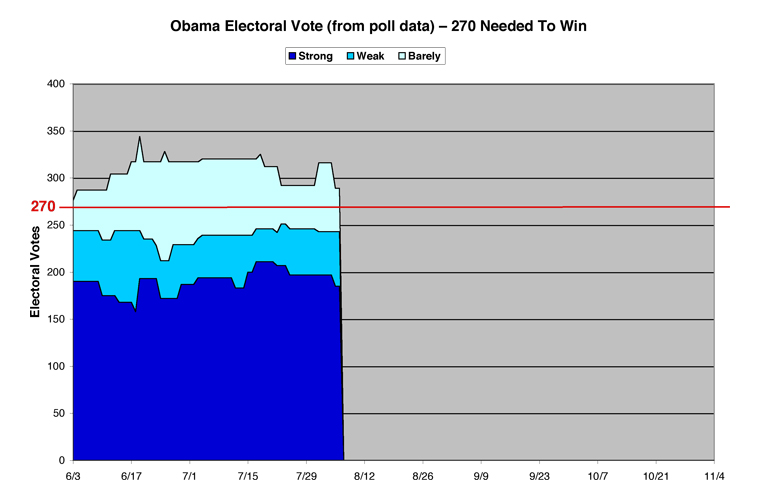
Barack Obama's chart shows some hiccups in the weakest of his support among the Barely states, but a fairly solid and steady amount of Strong and Weak support since the last time we looked at these charts. Although, again, the Strong support seems to be softening a bit into Weak, which is a disturbing trend to keep an eye on.
Barack's Strong support went from 211 to 185 in the past few weeks. He lost Minnesota, New Hampshire, and Massachusetts. But I still feel pretty confident that two of these states will be blue on Election Day, and the third (NH) is the smallest one, with only four electoral votes.
However, Barack's Weak states picked up the slack, going from 35 to 58 electoral votes, which is why the line you get when you add the two together has stayed almost perfectly straight the past few weeks. Weak plus Strong for Obama went from 246 to 243 overall.
The real movement in Barack's chart is in the Barely states. Many battleground states have gone back and forth, and so this is the most volatile area to make predictions. Part of the reason for such a big swing in this was Florida going for Obama, then back into McCain's column (since Florida has 27 electoral votes, it shows up in a big way on these charts). Barack went from 66 to 46 in the Barely states since last time we checked. Overall, this caused Obama's number to come down from 312 to 289. Which is still more than 270, even without Florida and Virginia, but the trends need to reverse or at least flatten out for Obama to successfully hold these numbers.
Since this is running a bit long here, I'm not going to make predictions this time around, but rather just identify how I personally divide the states up (which relies on more than just data from these charts).
Safe States
I'm going to take New Hampshire away from this column, as support seems to be weakening for Obama there. But to replace it, I'm going to move Oregon into the "Safe" category for Obama. The latest poll there showed him with a nine percent lead over McCain, so this is a fairly safe bet. Obama's total Safe list of states: CA, CT, DC, HI, IA, IL, MA, MD, ME, MN, NJ, NY, OR, RI, VT, WA, WI. That adds up to 17 states (and 214 electoral votes) in Obama's "Safe" category.
States I would call as "Probable" for Obama had some movement as well. Oregon moves up to Safe, and New Hampshire comes down from Safe. For now, I'm also moving Pennsylvania into Probable for Obama. Obama's Keystone State support has wobbled, but appears to be firming up a bit for him. This is important, as Pennsylvania is a much-needed state for Obama. So, Obama's Probable list (DE, NH, NM, PA) adds four more states and 33 more electoral votes, for a total between Safe and Probable of 247 electoral votes, just 23 shy of the 270 needed to win.
John McCain's Safe states have added Mississippi and South Carolina, for a total of 14 states, but only 97 electoral votes (AL, AR, AZ, ID, KS, KY, LA, MS, NE, OK, SC, TN, UT, WY).
McCain's Probable states lost two (MS and SC) which moved up to Safe, and lost Florida to being a Tossup (McCain's poll support has wavered here). Although Florida is a heavyweight, I am also adding another heavyweight to Probable for McCain -- Texas. So McCain's Probable list (AK, TX, WV) has only three states but a whopping 42 electoral votes.
Of course, this still puts him way behind when you add Safe and Probable, which only gives McCain a total of 139 electoral votes. That is 131 votes shy of the 270 needed to win.
So Obama's still got many more ways to engineer a win. Obama is down only 23 electoral votes, while McCain still pretty much needs to run the table to get the 131 he needs.
The battleground states
This leaves 13 states as the battlegrounds, which share 152 electoral votes between them (total adds up to 51 states due to Washington, D.C.). These are broken down into "leaning" states for Obama and McCain, and the "too close to call" Tossup states.
Tossup states leaning Obama right now are Colorado and Michigan. Since last time, Pennsylvania firmed up for Obama, moving to Probable. Montana dropped down to "too close to call," but Colorado moved up from the same category. I would really love to move Michigan to at least Probable for Obama, but so far the polls haven't reflected strong support for him here. Michigan is another crucial state for Obama to win, so it's one to keep an eye on. And while Colorado is definitely trending Democratic, the polls are still showing only tepid support so far for Obama. Maybe the Democratic convention (in Denver) will help, later this month. These two states add up to 26 electoral votes leaning Obama's way.
Tossups leaning McCain are: Georgia, Missouri, North Carolina, and South Dakota. Texas moved up into Probable for McCain, and he picks up Missouri from the "too close to call" category, at least for now. McCain's Georgia poll numbers are good, but not great (and there's always favorite son Bob Barr in the mix there). But while any of them could go Obama's way eventually, they're all leaning McCain as of now. These four states add 44 electoral votes, cutting what McCain needs to win down to a (still formidably big) 87 electoral vote shortage. As I said, McCain really needs to run the tables to have any sort of chance of winning, as things stand now.
As far as the rest of them go, they're all too close and too volatile for me to call one way or another. The final seven battleground states are: Florida, Indiana, Montana, Nevada, North Dakota, Ohio, and Virginia. Between them they share 82 electoral votes. Colorado moved to Obama, but Montana moved from Obama to here. Missouri went towards McCain, but Florida came from McCain at the same time.
Overall, things still look very, very good for Obama. But the trendlines are indeed a bit worrisome.
[Blatant website plug: ChrisWeigant.com has just added a new 2008 Electoral Graphics page with a constantly-updated electoral graph and electoral map. These are different graphs than the ones I use here, and are created by Samuel Minter of Abulsme.com. The data gathering and methodology he uses is superior to what I have used, as he averages the last five state polls for every state (which smoothes out the outlier poll numbers). I encourage you to check this page on a daily basis to see how the trendlines are moving, right up to the election.]
[Electoral Vote Data, for the wonkily-inclined:]
Barack Obama Likely Easy Wins -- 21 States -- 247 Electoral Votes
Safe States -- 17 States -- 214 Electoral Votes
California (55), Connecticut (7), Hawaii (4), Illinois (21), Iowa (7), Maine (4), Maryland (10), Massachusetts (12), Minnesota (10), New Jersey (15), New York (31), Oregon (7), Rhode Island (4), Vermont (3), Washington (11), Washington DC (3), Wisconsin (10)
Probable States -- 4 States -- 33 Electoral Votes
Delaware (3), New Hampshire (4), New Mexico (5), Pennsylvania (21)
John McCain Likely Easy Wins -- 17 States -- 139 Electoral Votes
Safe States -- 14 States -- 97 Electoral Votes
Alabama (9), Arizona (10), Arkansas (6), Idaho (4), Kansas (6), Kentucky (8), Louisiana (9), Mississippi (6), Nebraska (5), Oklahoma (7), South Carolina (8), Tennessee (11), Utah (5), Wyoming (3)
Probable States -- 3 States -- 42 Electoral Votes
Alaska (3), Texas (34), West Virginia (5)
Tossup States -- 13 States -- 152 Electoral Votes
Tossup States Leaning Obama -- 2 States -- 26 Electoral Votes
Colorado (9), Michigan (17)
Tossup States Leaning McCain -- 4 States -- 44 Electoral Votes
Georgia (15), Missouri (11), North Carolina (15), South Dakota (3)
Too Close To Call -- 7 States -- 82 Electoral Votes
Florida (27), Indiana (11), Montana (3), Nevada (5), North Dakota (3), Ohio (20), Virginia (13)
Cross-posted at The Huffington Post
-- Chris Weigant


"I would really love to move Michigan to at least Probable for Obama, but so far the polls haven't reflected strong support for him here." - CW
Actually. If you plot the polls listed at that site, then add a linear trendline, you see that Obama is gaining support over time and McCain is actually losing support. If you look at the Rasmussen polls to keep with the same methodology, the trend lines don't change all that much but you can clearly see that Obama is steadily increasing support while McCain is losing. Projected out it looks to be 56% to 42% by Nov 4th at current trends.
"As far as the rest of them go, they're all too close and too volatile for me to call one way or another. The final seven battleground states are: Florida, Indiana, Montana, Nevada, North Dakota, Ohio, and Virginia." - CW
By my charts, I'm predicting:
Florida: Obama by 4%
Indiana: Obama 54%, McCain 46% (laugh... go ahead :p)
Nevada: McCain by 4% (Unless Richardson is VP)
Montana/ND: toss ups
Ohio: Obama by 3%
Virginia: Obama by 7%
Georgia: Super close
Missouri: McCain by 4%
Colorado: Obama by 2%
New Hampshire: Obama by 3%
BLaws -
I took a look at Michigan's data, and I'm hoping you're right. It looks pretty good for Obama there for now.
By my math, using your predictions, this equates to:
Obama 344
McCain 173
Too close to call 21
I'd be pretty happy with that result, personally!
-CW
Hi Chris, i produce and direct videos for GOOD Media (GOOD Magazine) and just finished a video on the battleground states that used much of your math and research as a basis. We also factored in many other articles, opinions, and polls but this is what we ended up with:
you are listed in the sources (under huffington post). curious to know what you think...
-m