
Charting The Electoral Math Looks Good For Obama
It's been about a month since we last took a look under the microscope at the possible outcomes of the Electoral College vote this November, so it's time for an update. For those of you too busy to read this, I will sum it up for you in advance: Looks good for Obama!
Now, I don't want anyone to be swept up in untimely exuberance, and firmly caution against prematurely popping champagne corks here. There's a lot of time left in this race, and anything can happen. But things are undeniably looking good for Obama's chances of winning versus McCain's.
Let's start off with a general overview of how the race shapes up. A few caveats, first. These graphs were created using data from the electoral-vote.com website, and I can't personally vouch for their accuracy. These are all state polls, and not national polls. Some local pollsters are better at understanding their state's demographics than the national pollsters are, and some are not. And sometimes everybody gets it wrong (see: New Hampshire Democratic primary, for instance). Polling itself may be missing people with cell phones (and no land lines), and may also be missing new voters (many polls only look at "likely voters," defined as those who have voted previously). And these state polls are only updated sporadically, meaning some of this information is months out of date. So I'm not saying that these polls are going to reflect perfectly the outcome of the vote, in other words, but then no poll can really make such a claim. But you have to use the data available, and the electoral-vote.com website has one of the better presentations of available data, so I chose to use their figures.
OK, enough caveats. Polls aren't perfect, I think we all understand that. But they can be instructive nevertheless.
So let's take an overview of the entire race, to begin with. This first chart (click on it to see a larger version) shows John McCain's share of the electoral vote (as determined by state poll) and Barack Obama's share as well. They are shown as percentages. McCain is red, Obama is blue, and ties are white. All of these charts cover the period of time from when Obama wrapped up the Democratic nomination to Election Day. There's a lot of blank space on the right side as a result of this, but this way I can keep updating these charts throughout the campaign consistently.
[I am experimenting with livening these dry statistics up with some bright, eye-catching graphics here, but this is the first time I've posted charts, so apologies if they don't come out 100% right.]
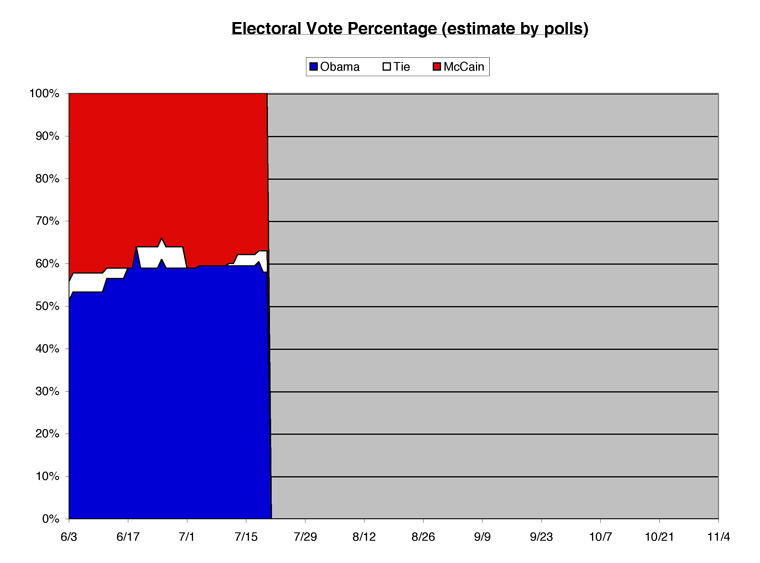
Obama starts just over 50% and starts rising. Within two weeks, he has hit a steady range of the high 50s, occasionally bumping up to over 60%. This translates into around 310-320 electoral votes for Obama, a number which has remained fairly consistent since mid-June.
Let's drill down into each candidate's numbers, to see the depth of their support. First, John McCain.
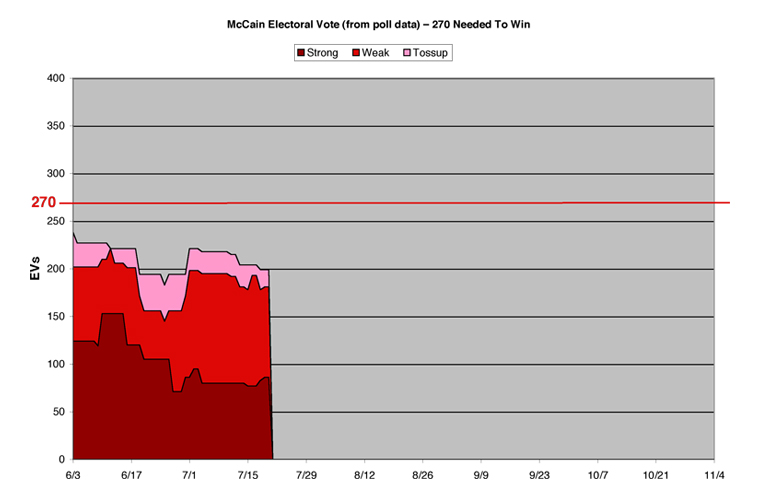
Electoral-vote.com divides each candidate's states up into three categories: Strong, Weak, and Barely (listed on the chart as "Tossup"). Strong means leading by ten points or better in the polls. Weak means five to ten points up. Barely/Tossup is anything below five points. Ties are not counted for either candidate (currently, for instance, three states are tied: Virginia, North Dakota, and Missouri).
As you can see, John McCain's Strong support peaked in early June at around 150 electoral votes, and since then has fallen to the range around 80, where it has remained fairly constant since the beginning of July. But his Weak numbers have expanded at the same time, leaving him just under where he was in early June if you add both numbers together (around 170-175). But even when you add in the Tossup states, he's still over 70 electoral votes away from victory.
As a contrast, let's take a look at Obama's numbers:
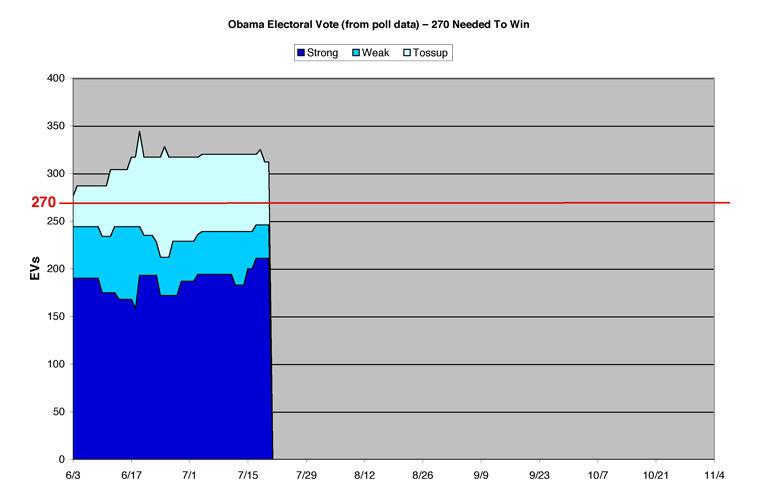
As you can see, this is a much happier graph. Obama's Strong support has been recently climbing, and now stands at an impressive 211 electoral votes. Some of this support has come from his Weak states, meaning that the total for the two hasn't changed a whole lot since June. But the key thing to understand is, Obama is just shy of 250 for the total. He stands today at 246 electoral votes from Strong and Weak states. Which means he only has to pick up 24 more votes to win.
Even more impressive is the total when you add in the Tossup states leaning toward Obama. This total (when added to Strong and Weak) has not fallen below 300 electoral votes since mid-June. Let me repeat that number, in case you missed it -- three hundred.
It currently stands at 312. It's been higher than 320 at times.
And that, my friends, would be a landslide.
Calling the race
But the numbers don't tell the whole story. For that, we have to examine the state-by-state matchups and make some educated guesses. I'll keep this brief, since the charts took up a lot of room, and just call the differences from the first article I wrote where I attempted to do this. If you want a little bit more explanation for some of these states, you can review the original column.
Safe States
Obama adds four safe states, and loses none. Connecticut goes Obama (this one wasn't really weak to begin with, it just took the pollsters a while to get around to polling it again). Iowa goes from "probable" to safe this time around as well. Minnesota and New Hampshire can now also be counted as safe for Obama.
Obama's total list of 17 safe states: CA, CT, DC, HI, IA, IL, MA, MD, ME, MN, NH, NJ, NY, RI, VT, WA, WI. This adds up to the aforementioned 211 electoral votes (full data is listed at the end of this article, for the curious).
Probable states for Obama have shrunk, but that's because four of them moved to the safe category. And one state -- Oregon -- moves from the "too close to call" category into a probable Obama pickup. Three states total in this category: Delaware, New Mexico, and Oregon, for a total of 15 electoral votes. Add this to the safe states and you get 226 fairly safe electoral votes for Obama.
McCain also added a few states to his safe list. Arkansas, Louisiana, and Nebraska can all be considered safe for McCain. This improves his total list of 12 states: AL, AR, AZ, ID, KS, KY, LA, NE, OK, TN, UT, WY. However, it still leaves his total safe electoral votes at a lowly 83.
McCain's probable states changed quite a bit from last time, losing two (AR, NE) to the safe list, but also losing two (ND, SD) to the tossup category. But McCain moved three more states (AK, FL, MS) from tossup to probable, so it all balances a bit. His probable list this time around: AK, FL, MS, SC, WV. These states total 49 electoral votes, meaning McCain's overall likely electoral vote is now 132.
The battleground states
The list of battleground states has shrunk a bit, due to the race firming up. First, the states leaning McCain at the moment: GA, NC, SD, TX. Next, the states leaning Obama: MI, MT, PA. And finally, the states which are considered too close to call: CO, IN, MO, NV, ND, OH, VA.
From these three battleground groups, we mix and match to come up with our four scenarios: Best Case McCain, Realistic, Best Case Obama, and (just for the fun of it) Landslide Obama.
Best case McCain
Michigan and Pennsylvania are too close to call on election night. Later in the evening, Montana also is too close to call without a recount. But, unfortunately for Obama, none of this matters, as McCain runs the board of the remaining states (CO, IN, MO, NV, ND, OH, VA, GA, NC, SD, TX), gaining him 271 electoral votes, and the win. I do not consider this outside the bounds of possibility, as if you look at that list you'd be hard-pressed to point out any state where McCain doesn't have a decent shot at winning. Colorado and Ohio are probably the toughest to make a case for, but the possibility does indeed exist.
Realistic outcome
This may be realistic, but it's also inconclusive. McCain picks up Indiana, North Dakota, Georgia, Montana, North Carolina, South Dakota, and Texas. Obama picks up Colorado and Pennsylvania. This leaves the score at McCain - 216; Obama - 256.
Too close to call: Missouri, Nevada, Michigan, Ohio, Virginia.
To win, McCain has to pick up four of these five states -- and three of them have to be Michigan, Ohio, and Virginia. That's a pretty tall order, but it could happen.
Obama, on the other hand, has to pick up only two of these five states -- and it doesn't matter which two. If he wins any two, he wins the contest. Furthermore, if he wins Ohio or Michigan alone, he also wins the race. Pretty good odds, I have to admit.
Best case Obama
McCain takes Texas and South Dakota. But Obama sweeps Colorado, Michigan, Montana, Nevada, Ohio, Pennsylvania, and Virginia. Too close to call are Georgia (due to Bob Barr on the ballot), Indiana, Missouri, North Carolina, and North Dakota.
But none of them matter, because Obama has already won, with 314 electoral votes to 169 for John McCain.
Obama landslide
McCain takes Texas and South Dakota. Obama, however, picks up every state mentioned in the previous scenario: CO, GA, IN, MI, MO, MT, NC, ND, NV, OH, PA, VA.
Surprisingly, Alaska, Florida and Louisiana are too close to call on election night, but nobody will care because Obama will already have 369 electoral votes and the only question is how much bigger his landslide will ultimately be.
[As always, it's been fun (because Obama's doing so well, mostly). Let me know if there are any problems with the charts....]
[Electoral Vote Data]
Barack Obama Likely Easy Wins -- 20 States -- 226 Electoral Votes
Safe States -- 17 States -- 211 Electoral Votes
California (55), Connecticut (7), Hawaii (4), Illinois (21), Iowa (7), Maine (4), Maryland (10), Massachusetts (12), Minnesota (10), New Hampshire (4), New Jersey (15), New York (31), Rhode Island (4), Vermont (3), Washington (11), Washington DC (3), Wisconsin (10)
Probable States -- 3 States -- 15 Electoral Votes
Delaware (3), New Mexico (5), Oregon (7)
John McCain Likely Easy Wins -- 17 States -- 132 Electoral Votes
Safe States -- 12 States -- 83 Electoral Votes
Alabama (9), Arizona (10), Arkansas (6), Idaho (4), Kansas (6), Kentucky (8), Louisiana (9), Nebraska (5), Oklahoma (7), Tennessee (11), Utah (5), Wyoming (3)
Probable States -- 5 States -- 49 Electoral Votes
Alaska (3), Florida (27), Mississippi (6), South Carolina (8), West Virginia (5)
Tossup States -- 14 States -- 180 Electoral Votes
Tossup States leaning McCain -- 4 States -- 67 Electoral Votes
Georgia (15), North Carolina (15), South Dakota (3), Texas (34)
Tossup States leaning Obama -- 3 States -- 41 Electoral Votes
Michigan (17), Montana (3), Pennsylvania (21)
Too Close to call -- 7 States -- 72 Electoral Votes
Colorado (9), Indiana (11), Missouri (11), Nevada (5), North Dakota (3), Ohio (20), Virginia (13)
Cross-posted at The Huffington Post
-- Chris Weigant


Chart update!
[OK, I'm obsessing about the charts, I admit it.]
I have been sent a link to a very cool chart which combines the three charts I have above. Well, not exactly, as he uses a slightly different method of obtaining his data, but the concept is really well done, and provides all the info in my three charts in a single image. I urge everyone to check it out:
http://wiki.abulsme.com/2008_Electoral_College_Prediction
Enjoy!
-CW
I know something that could have the potential of throwing a very big monkey wrench into everbody's pretty electoral projection charts and very likely ensure a governable majority, if not a landslide, for Senator Obama but let's just say that the odds are not in its favor as it involves the unfortunate and wholly unnecessary existence of ‘vetters’ and search teams who couldn't find their...well, you know...
Just sayin'...